StockFetcher Forums · Filter Exchange · Alpha Filter based on Ron Groenke Visions V<< 1 ... 2 3 4 5 6 ... 9 >>Post Follow-up
nibor100
1,010 posts
msg #146562
Ignore nibor100
2/14/2019 9:32:24 AM

Well I had 503 results when I looked at that corrected filter in my last post in the Preview window; but viewing that post directly in the forum after I posted it, I see no results, a mystery....
Ed S.


Cheese
1,374 posts
msg #146563
Ignore Cheese
2/14/2019 10:02:56 AM

Fetcher[
set{bla, high 52 week high - low 52 week low}
set{blb, bla * .25}
set{bl, low 52 week low + blb}

set{bra, bl - close}
set{brb, 10 * bra}
set{brc, brb / blb}
set{m10, ma(10)}
set{cls, close}
set{cls2, close}
set{cls3, close}
set{m20, ma(20)}
set{m15, ma(50) * 1.05}
set{m95, ma(50) * .95}
set{taa, ma(50) * 2}
set{tab, taa - close}
set{tac, ma(50) / tab }
set{tad, tac + 1}
set{tai, brc * tad}

set{pointb1, bla * .125}
set{pointb, bl + pointb1}

set{pointc, low 52 week low + pointb1}

set{gr, count(tai above 10,1)}
set{ta, count(tai between -5 and 10,1)}
set{wait, count(tai between -10 and -4.9,1)}
set{bad_idea, count(tai below -10,1)}

set{abvpc,count(close is above pointc,20)}

set{cabvpc, count(close > pointc,1)}
set{cblopb, count(close < pointb,1)}
set{in_zone, cabvpc * cblopb}

set{upa, count(close > close 1 day ago,1)}
set{upb, count(close > close 2 days ago,1)}
set{upc, count(close > close 3 dsys ago,1)}
set{upd, upa + upb}
set{up, upd + upc}


set{g2, up * 10}/*days up * 10*/

set{g3, in_zone * 30}/* within Pointb and pointc * 30 will be either 0 or 30*/
set{g4, abvpc + g3}/*days between pointb and pointc + 30 or 0*/
set{g4a, 2 * g4}/*2 * Number of days between pointb and pointc */
set{g5, g2 + g4a}/* 10 * Number of days up + 2 * Number of days between pointb and pointc */
add column separator
add column up{days_up}

add column g2
add column g3
add column g4
add column g4a{gold}


s&p 500

draw bl on plot price
draw ma(50)

draw tai line at 10
draw tai line at -5
draw tai line at -31
draw tai line at -50


/* draw brc line at 10
draw brc line at 5*/

draw cls on plot m10
draw m15 on plot m10
draw m95 on plot m10

draw pointc on plot price
draw pointb on plot price

draw m20 on plot cls3
draw low 52 week low


add column bl{buy_limit}
add column brc{buyrank}
add column separator
add column tai

add column gr{get_ready}
add column ta{take_action}
add column wait
add column bad_idea
add column separator
draw Slow Stochastics Fast %K(13,3,3)

set{vxxc, ind(vxxb,close)}
set{vixc, ind(^vix,close)}
set{vxvc, ind(vxv,close)}
set{spyc, ind(spy,close)}
set{spxl, ind(spxl,close)}
set{vix3, ind(^VIX3M,close)}
set{ijrc, ind(ijr,close)}
set{iefc, ind(ief,close)}

set{vxvvix, vxvc / vixc}
set{vixavg, cema(vxvvix,5)}
set{vxvvxx, vxvc / vxxc}
set{vxxavg, cema(vxvvxx,5)}

set{ijrief, iefc / ijrc}
set{ijriefavg, cema(ijrief,5)}


set{riskon, count(vxvvxx > or = to vxxavg,1)}
set{riskof, count(vxvvxx < or = to vxxavg,1)}

set{risk_on, count(vxvvxx crossed above vxxavg,1)}
set{risk_of, count(vxvvxx crossed below vxxavg,1)}
draw vxvvxx on plot vxxavg
draw ijrief on plot ijriefavg
draw riskon
draw riskof

chart-length 6 months
]


Cheese
1,374 posts
msg #146564
Ignore Cheese
2/14/2019 10:04:52 AM

nibor100,
I sometimes experienced that mystery, too when I appended a clickable filter to some comments.

Cheese
1,374 posts
msg #146565
Ignore Cheese
2/14/2019 10:12:43 AM

Fetcher[
/* https://www.stockfetcher.com/forums/Filter-Exchange/Alpha-Filter-based-on-Ron-Groenke-Visions-V/146465/20 */
/* SAFeTRADE nibor 2/13/2019 Ron Groenke Visions V */
/* with symlist, not sp500, for market pulse, not stock pick */

set{bla, high 52 week high - low 52 week low}
set{blb, bla * .25}
set{bl, low 52 week low + blb}

set{bra, bl - close}
set{brb, 10 * bra}
set{brc, brb / blb}
set{m10, ma(10)}
set{cls, close}
set{cls2, close}
set{cls3, close}
set{m20, ma(20)}
set{m15, ma(50) * 1.05}
set{m95, ma(50) * .95}
set{taa, ma(50) * 2}
set{tab, taa - close}
set{tac, ma(50) / tab }
set{tad, tac + 1}
set{tai, brc * tad}

set{pointb1, bla * .125}
set{pointb, bl + pointb1}

set{pointc, low 52 week low + pointb1}

set{gr, count(tai above 10,1)}
set{ta, count(tai between -5 and 10,1)}
set{wait, count(tai between -10 and -4.9,1)}
set{bad_idea, count(tai below -10,1)}

set{abvpc,count(close is above pointc,20)}

set{cabvpc, count(close > pointc,1)}
set{cblopb, count(close < pointb,1)}
set{in_zone, cabvpc * cblopb}

set{upa, count(close > close 1 day ago,1)}
set{upb, count(close > close 2 days ago,1)}
set{upc, count(close > close 3 dsys ago,1)}
set{upd, upa + upb}
set{up, upd + upc}


set{g2, up * 10}/*days up * 10*/

set{g3, in_zone * 30}/* within Pointb and pointc * 30 will be either 0 or 30*/
set{g4, abvpc + g3}/*days between pointb and pointc + 30 or 0*/
set{g4a, 2 * g4}/*2 * Number of days between pointb and pointc */
set{g5, g2 + g4a}/* 10 * Number of days up + 2 * Number of days between pointb and pointc */
add column separator
add column up{days_up}

add column g2
add column g3
add column g4
add column g4a{gold}


SYMLIST(SPY,QQQ,IWM) as market pulse, not stock pick */
/* s&p 500 */

draw bl on plot price
draw ma(50)

draw tai line at 10
draw tai line at -5
draw tai line at -31
draw tai line at -50


/* draw brc line at 10
draw brc line at 5*/

draw cls on plot m10
draw m15 on plot m10
draw m95 on plot m10

draw pointc on plot price
draw pointb on plot price

draw m20 on plot cls3
draw low 52 week low


add column bl{buy_limit}
add column brc{buyrank}
add column separator
add column tai

add column gr{get_ready}
add column ta{take_action}
add column wait
add column bad_idea
add column separator
draw Slow Stochastics Fast %K(13,3,3)

set{vxxc, ind(vxxb,close)}
set{vixc, ind(^vix,close)}
set{vxvc, ind(vxv,close)}
set{spyc, ind(spy,close)}
set{spxl, ind(spxl,close)}
set{vix3, ind(^VIX3M,close)}
set{ijrc, ind(ijr,close)}
set{iefc, ind(ief,close)}

set{vxvvix, vxvc / vixc}
set{vixavg, cema(vxvvix,5)}
set{vxvvxx, vxvc / vxxc}
set{vxxavg, cema(vxvvxx,5)}

set{ijrief, iefc / ijrc}
set{ijriefavg, cema(ijrief,5)}


set{riskon, count(vxvvxx > or = to vxxavg,1)}
set{riskof, count(vxvvxx < or = to vxxavg,1)}

set{risk_on, count(vxvvxx crossed above vxxavg,1)}
set{risk_of, count(vxvvxx crossed below vxxavg,1)}
draw vxvvxx on plot vxxavg
draw ijrief on plot ijriefavg
draw riskon
draw riskof

chart-length 6 months
]


SAFeTRADE
630 posts
msg #146570
Ignore SAFeTRADE
2/14/2019 1:21:41 PM

Visions V is still a work in progress. I am trying to simply it and make it easier to use with not to
much data or visual distraction. This my latest version. I am attempting to use an oscillator to
replicate the V. I have chosen to use Stochastic %K(50,50,4) thanks to snappfrog's use of
Stochastic %K(40,40,4). I have converted the close to a value from 0 to 100 using indposition.
Fetcher[s&P 500

set{52wklow, count(low reached a new 52 week low,1)}
set{stcross, count(Stochastic %K(40,40,4) crossed above 20,1)}


set{bla, high 52 week high - low 52 week low}
set{blb, bla * .25}
set{bl, low 52 week low + blb}

set{bra, bl - close}
set{brb, 10 * bra}
set{brc, brb / blb}

set{cls, close}
set{m15, ma(50) * 1.05}
set{m95, ma(50) * .95}
set{taa, ma(50) * 2}
set{tab, taa - close}
set{tac, ma(50) / tab }
set{tad, tac + 1}
set{tai, brc * tad}

set{pointb1, bla * .125}
set{pointb, bl + pointb1}

set{pointc, low 52 week low + pointb1}

set{m50percent, close / ma(50)}
set{space,0}
set{space2, 0}

draw ma(50)
draw ma(13)
draw Stochastic %K(50,50,4)
draw low 52 week low

set{clsval, indposition(close,60)*100}
set{clsvalx20, count(clsval crossed above 20,1)}

set{upa, count(close > close 1 day ago,1)}
set{upb, count(close > close 2 days ago,1)}
set{upc, count(close > close 3 dsys ago,1)}
set{upd, upa + upb}
set{up, upd + upc}

draw clsval on plot Stochastic %K(50,50,4)
draw space
draw tai line at -5
draw tai line at 10
draw space2
draw m50percent line at 1.05
draw m50percent line at .95
draw 52wklow
draw stcross
draw clsvalx20
draw blval

draw bl on plot price
draw pointb on plot price
draw pointc on plot price
add column bl
add column blval
add column up{days_up}
add column brc{buy_rank}
add column tai
add column stcross


chart-length 6 months
]


miketranz
956 posts
msg #146583
Ignore miketranz
modified
2/14/2019 10:13:58 PM

I noticed on the first filter that was posted 2/17/19,pull up the QQQ 1 year chart,when the slow stochastics 12,3 lower indicator hit 20 or below,9 out of 10 times the index went up the next day for a profitable 4-7 day hold.That's 90% in my book,simple,basic system,and I didn't go to college.Show me a better one.Best,Miketranz....

SAFeTRADE
630 posts
msg #146584
Ignore SAFeTRADE
2/14/2019 10:40:38 PM

I see what you mean Mike.

Cheese
1,374 posts
msg #146585
Ignore Cheese
2/14/2019 11:12:55 PM

Many years ago, Muddy Wallman gave us his simple and powerful filter
fast stochastics %K(14) below 10
which is pretty close to
slow stochastics %K(12,3) below 20

But I thought the Groenke system is also about getting ready, wait,
when to take action, when not.
WDIK I'm still a Groenke noob.

Cheese
1,374 posts
msg #146589
Ignore Cheese
2/15/2019 11:06:45 AM

Firstly, I want to thank SAFeTRADE and everyone (in the 2015 & 2019 threads) for your thoughts and good info.
Here is what I have got so far about the Groenke system:
Groenke system makes use of new 52-week lows. Common trading wisdom tells peeps that when
stocks reach a new 52-week low, they are in a clear down trend, and the likely next move would be
down. I believe a real value of the Groenke toolkit is to help us avoid head fakes and eventually buy
at a good time at a good price, something that %K(12,3) cannot do on its own.

The following chart was from SAFeTRADE filter of 2019/02/14, It shows that Groenke system helped
avoid fake %K12 signals and taking losing trades in several earlier "new 52-week lows" after which
prices kept going down.


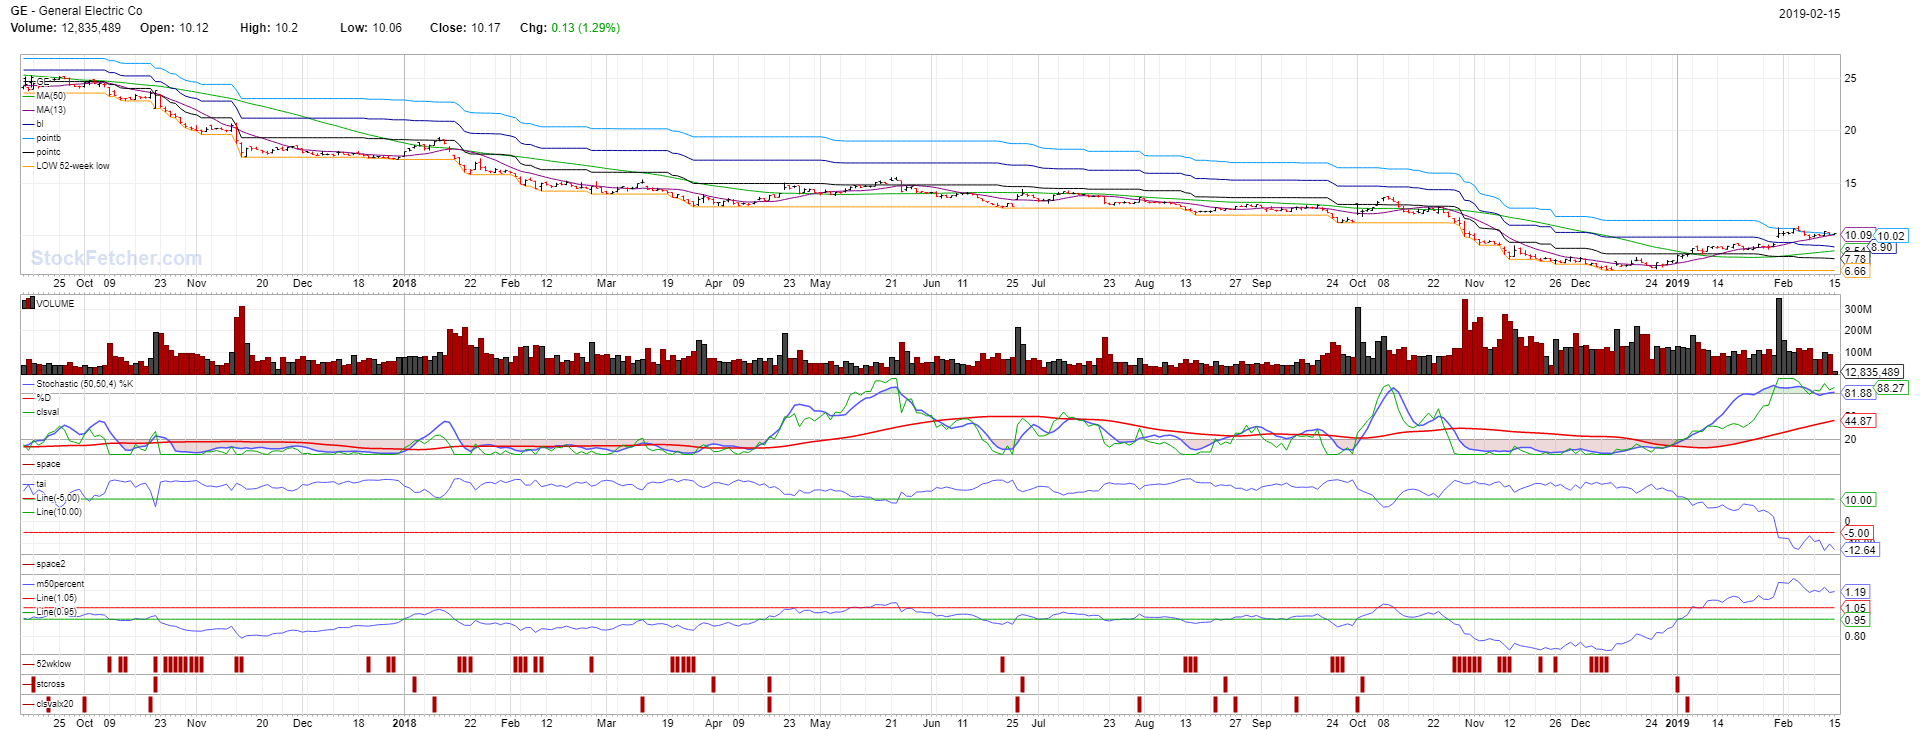
Now look at this chart and see the potential reward with buying around a new 52-week low at the right time


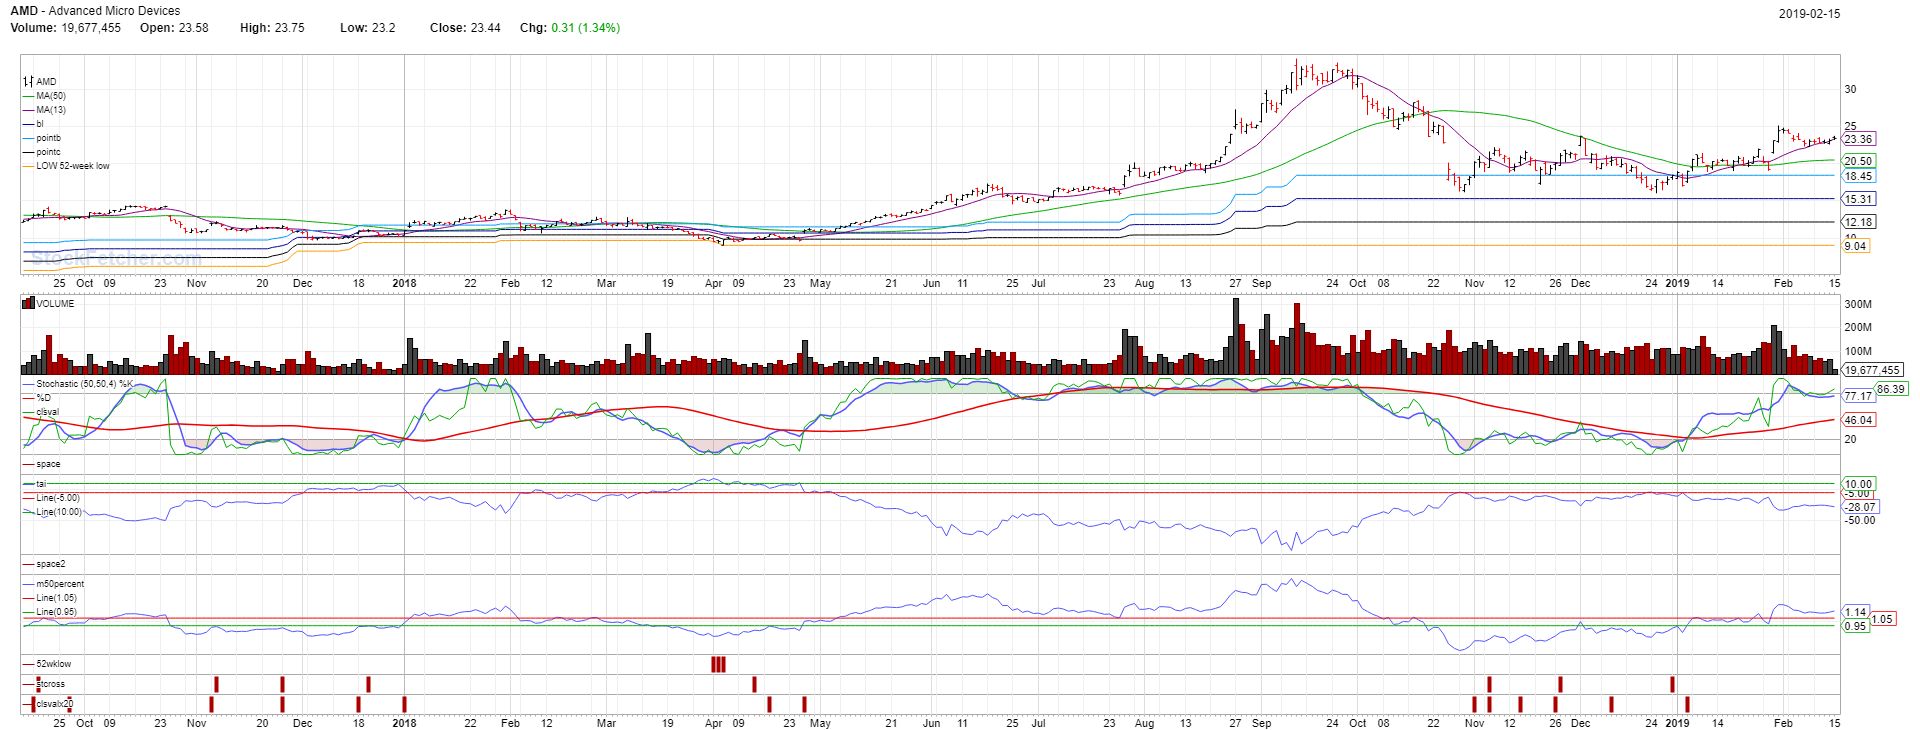
When Muddy Wallman gave us his simple and powerful filter
fast stochastics %K(14) below 10
he also told us to WAIT FOR GREEN
Subsequently, TRO picked up the baton, and kept reminding people to wait for green.

In his 12/17/2017 Groenke post, jdinkel reminded us that we'd have to wait for 3 days up,
which makes sense because the Groenke system is trying to buy near new 52-week lows,
an usually risky counter-trend move.


snappyfrog
653 posts
msg #146621
Ignore snappyfrog
2/19/2019 8:35:31 AM

Using this system, I added

3 day slope of the close > 0
tai crossed 10 from above

Both of these are I think important to success.

I am watching APC and QCOM for today.

StockFetcher Forums · Filter Exchange · Alpha Filter based on Ron Groenke Visions V<< 1 ... 2 3 4 5 6 ... 9 >>Post Follow-up

*** Disclaimer *** StockFetcher.com does not endorse or suggest any of the securities which are returned in any of the searches or filters. They are provided purely for informational and research purposes. StockFetcher.com does not recommend particular securities. StockFetcher.com, Vestyl Software, L.L.C. and involved content providers shall not be liable for any errors or delays in the content, or for any actions taken based on the content.


Copyright 2022 - Vestyl Software L.L.C.Terms of Service | License | Questions or comments? Contact Us
EOD Data sources: DDFPlus & CSI Data Quotes delayed during active market hours. Delay times are at least 15 mins for NASDAQ, 20 mins for NYSE and Amex. Delayed intraday data provided by DDFPlus


This site is protected by reCAPTCHA and the Google Privacy Policy and Terms of Service apply.