| StockFetcher Forums · Filter Exchange · Price Coming Off of a PVI Low | << 1 2 3 4 5 >>Post Follow-up |
| snappyfrog 753 posts msg #152036 - Ignore snappyfrog |
5/3/2020 5:25:09 AM I've been playing with NVI (negative volume index) and PVI (positive volume index) for a few days. This is the best I've come up with so far, but I am sure someone can help make this a better filter. PVI, better known as "retail traders", "FOMO" traders or "dumb money traders" typically rises while NVI "industrial traders" are selling off. I looked at several "lows" of the PVI and my sweet spot came up as the 22 day low line. When PVI starts rising off of the 22 day PVI low then runs typically go from 2 days to 60 days or more. As a swing trader of stocks and options, this is exactly the type of setup I like. Help me make this better! 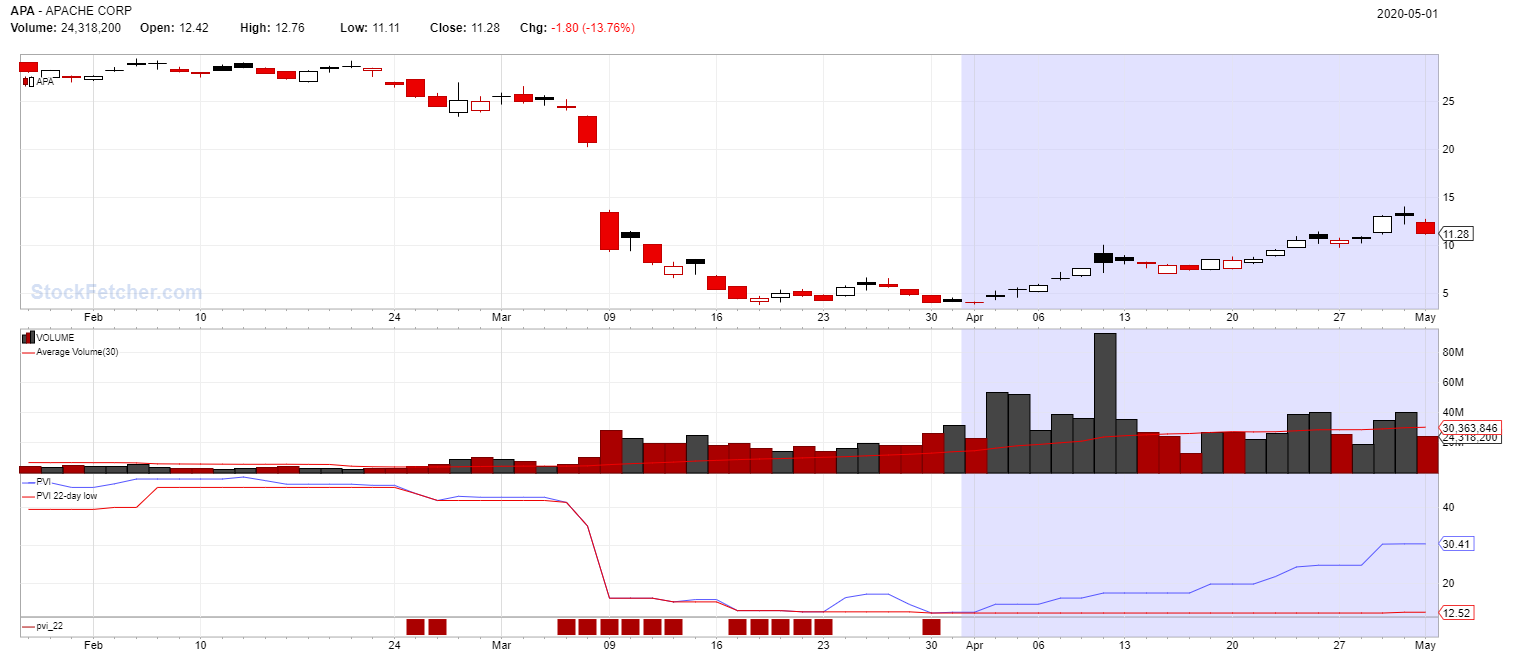 |
| sandjco 648 posts msg #152040 - Ignore sandjco |
5/3/2020 11:25:02 AM Thanks for sharing snappy! BTW, what is the R1, R2 and S1 and S2? SF auto calculates support and resistance? Also, I find using the "optionable" lingo seems to be a hit or miss...maybe it is just me... Here is my snappy inspired take on the filter.. |
| snappyfrog 753 posts msg #152046 - Ignore snappyfrog |
5/4/2020 8:26:40 AM Yes, SF support and resistance. |
| snappyfrog 753 posts msg #152119 - Ignore snappyfrog |
5/9/2020 10:01:49 AM Here is another PVI filter I am playing with at this time. Thoughts or suggestions welcome. |
| snappyfrog 753 posts msg #152120 - Ignore snappyfrog |
5/9/2020 10:45:50 AM Original filter on this post, updated: |
| Cheese 1,374 posts msg #152125 - Ignore Cheese |
5/9/2020 1:31:38 PM @snappyfrog and @kossvet Thanks for sharing There may be mutual benefits from your combined contributed ideas, e.g. |
| snappyfrog 753 posts msg #152130 - Ignore snappyfrog |
5/9/2020 7:53:57 PM Thanks Sandjco and Cheese! Always love how you guys can take something and add new twists. |
| snappyfrog 753 posts msg #152131 - Ignore snappyfrog |
5/9/2020 8:01:20 PM I have been playing some penny stocks as they have been having much better % gains of late. This one I got in at 0.19 and is at 0.25 now. PVI looks to be turning up again. I tend to look at up to 30 day trades on these pennies. 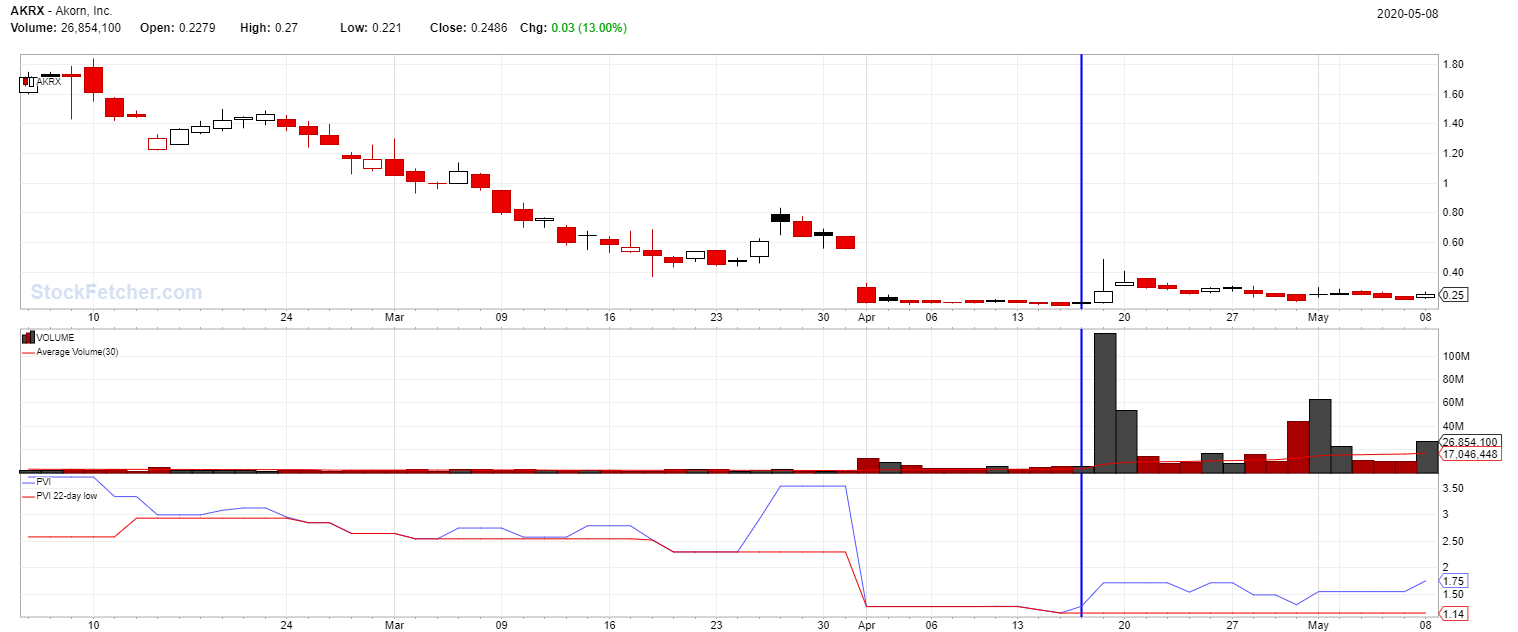 |
| snappyfrog 753 posts msg #152132 - Ignore snappyfrog |
5/9/2020 8:04:41 PM I got in RIG on May 1st, 3 days after the signal. 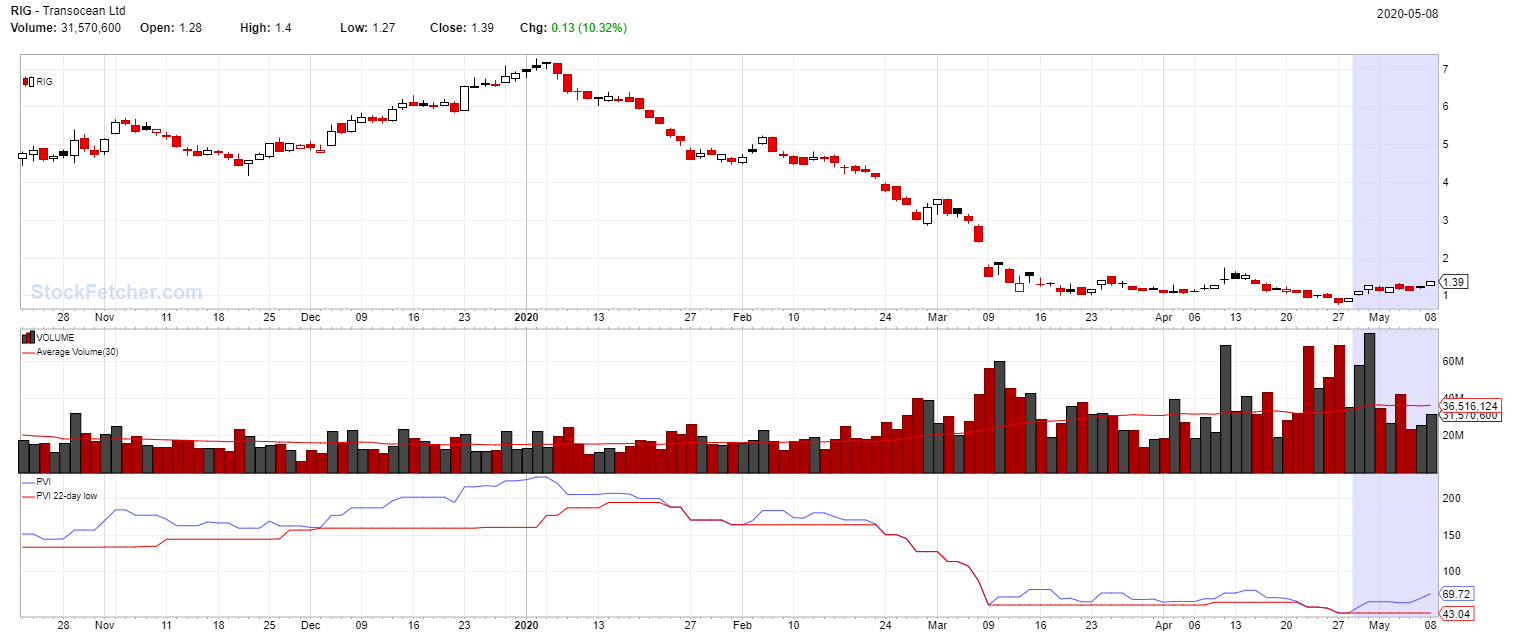 |
| kossvet 147 posts msg #152133 - Ignore kossvet |
5/9/2020 8:54:34 PM Thanks for the call out Cheese. Snappyfrogs filter definitely should be incorporated in Xarlors filter which I have modified. I did my DD with GNPX, TRIL. TORC is a quick trade, take your profit when the run-up starts to wane. I see GNPX being bought out. It's easy for me to hold a decent position when you have faith in the technology. I bought another 1000 shares bringing my total to 11K I also have 5k shares of Sava that I bought at $1.88 Again, their technology is cutting edge, and potentially life changing. Day trading for me is very difficult. Win some Lose some. I would rather research the stocks that Xarlors filter highlights. Then research them thoroughly. Then hold for a fair amount of time. Robert |
| StockFetcher Forums · Filter Exchange · Price Coming Off of a PVI Low | << 1 2 3 4 5 >>Post Follow-up |