| StockFetcher Forums · General Discussion · Stan Weinstein's Secrets For Profiting in Bull and Bear Markets | << 1 ... 4 5 6 7 8 ... 11 >>Post Follow-up |
| Mactheriverrat 3,178 posts msg #148714 - Ignore Mactheriverrat |
7/29/2019 11:25:37 AM $13.92 at Amazon but they also sell used. https://www.amazon.com/Stan-Weinsteins-Secrets-Profiting-Markets/dp/1556236832/ref=cm_cr_arp_d_product_top?ie=UTF8 |
| nibor100 1,102 posts msg #148717 - Ignore nibor100 modified |
7/29/2019 1:52:05 PM I got my $5.50 copy thru Amazon using about $3 of old Amazon credit card points/credits but it took a full 2 weeks to be delivered by snail mail. I'm 2/3 thru the book now and it is very thoroughly written from someone who published trading tips based on his 4 state approach for a long time before he ever wrote the book. When I was about 1/2 way thru I decided that the info contained in his many chart examples required me to build a spreadsheet so I could make better use of the info being provided. For example: a. by page 87 he has presented 26 graphs having Stage 2 profitable runs, averaging 246% gains, smallest being 44%, largest 871%, b. trade length averages 8.3 months with the shortest being 3 months and the longest being 16 months (I'm just now getting to the part of his book that discusses short term trading with the Stage 2 setups, so I may have to go back thru my spreadsheet and add 1/2/3 month gain columns. c. some may not have noticed but his preferred chart, in the bottom left corner, has 10 years of 52 week high and low data so I'm also documenting the prior all years high and low prices for further analysis ala Wishing Wealth blog GLB stocks. d. So far among those 26 charts he has some from 1971, 72, 75,78, 82,86,87, with the most from 86. He shows lots of chart on the other 3 stages but i'm not that interested in documenting them at this time... By the way if one goes to the Amazon website and searches for the book, when it comes up you can choose "Look inside" and see table of contents and read several pages to get a feel for the book, and if you have an Amazon account and you are logged in you get a lot more pages to read for free in the "Look Inside" option. For quite a while I wasn't going to buy the book because I thought I saw enough in the Amazon preview go get the gist, but as momentum grew on SF I started having more unsanswered questions rambling around in my grey matter (also I prefer to buy electronic books now and this one is too old for that) Ed S. |
| Mactheriverrat 3,178 posts msg #148720 - Ignore Mactheriverrat |
7/29/2019 5:17:10 PM Ed Yes the book is old (1988) but the theory is the same. Here is some other site that run the same theory . http://screener.nextbigtrade.com/#/markets https://www.nextbigtrade.com/stage-analysis/ those 2 are the same person. Then there is https://stageanalysis.net/forum/index.php If you register it will ask you a question why are you here or something like that Type in STAN WEINSTEIN |
| Mactheriverrat 3,178 posts msg #148721 - Ignore Mactheriverrat |
7/29/2019 6:00:01 PM Here is where all this weekly stuff started for me. I was searching youtube and came across this video which lead me in the long run to Stan Weinstein Weekly strategy . This video is just about the same strategy as Weinstein's more or less. |
| nibor100 1,102 posts msg #148722 - Ignore nibor100 |
7/29/2019 6:42:52 PM @Mactheriverrat, When I select the "Watchlist" option on the nextbigtrade Stage Analysis Screener website the top 2 stocks that come up in the list have" % from MA" for Friday that seem way off to me but perhaps its not supposed to be the distance away from the 30 week moving average? Thanks, Ed S. |
| miketranz 978 posts msg #148726 - Ignore miketranz modified |
7/29/2019 9:07:58 PM Show me stage 1 stocks to stalk or better yet,show me stage 2 breakouts on high volume.Miketranz... |
| Mactheriverrat 3,178 posts msg #148727 - Ignore Mactheriverrat |
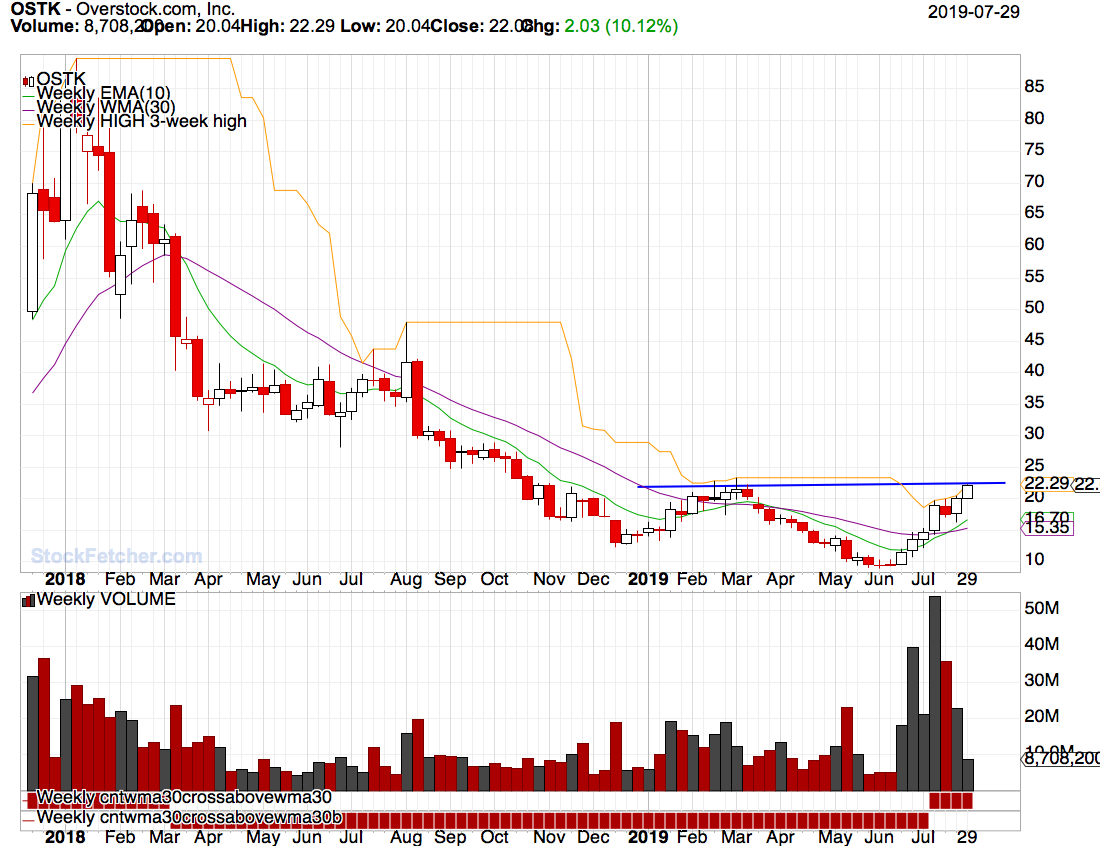
7/29/2019 9:44:05 PM How about OSTK - Monday it posted about 1/3 of its weekly average volume and that's just one day of five for the week. http://screener.nextbigtrade.com/#/symbol/ostk  |
| Mactheriverrat 3,178 posts msg #148728 - Ignore Mactheriverrat |
7/29/2019 10:13:09 PM @ ed I think on that web site that its the price from the ma30 also when I load mine its default is the ema9- You can change to ema30 and it will unless you close internet explorer |
| karennma 8,057 posts msg #148737 - Ignore karennma modified |
7/31/2019 8:49:40 AM I have not gotten the book yet, so .. To those of you who have read the book ... Are you able to foresee stage 3 coming? |
| Mactheriverrat 3,178 posts msg #148738 - Ignore Mactheriverrat |
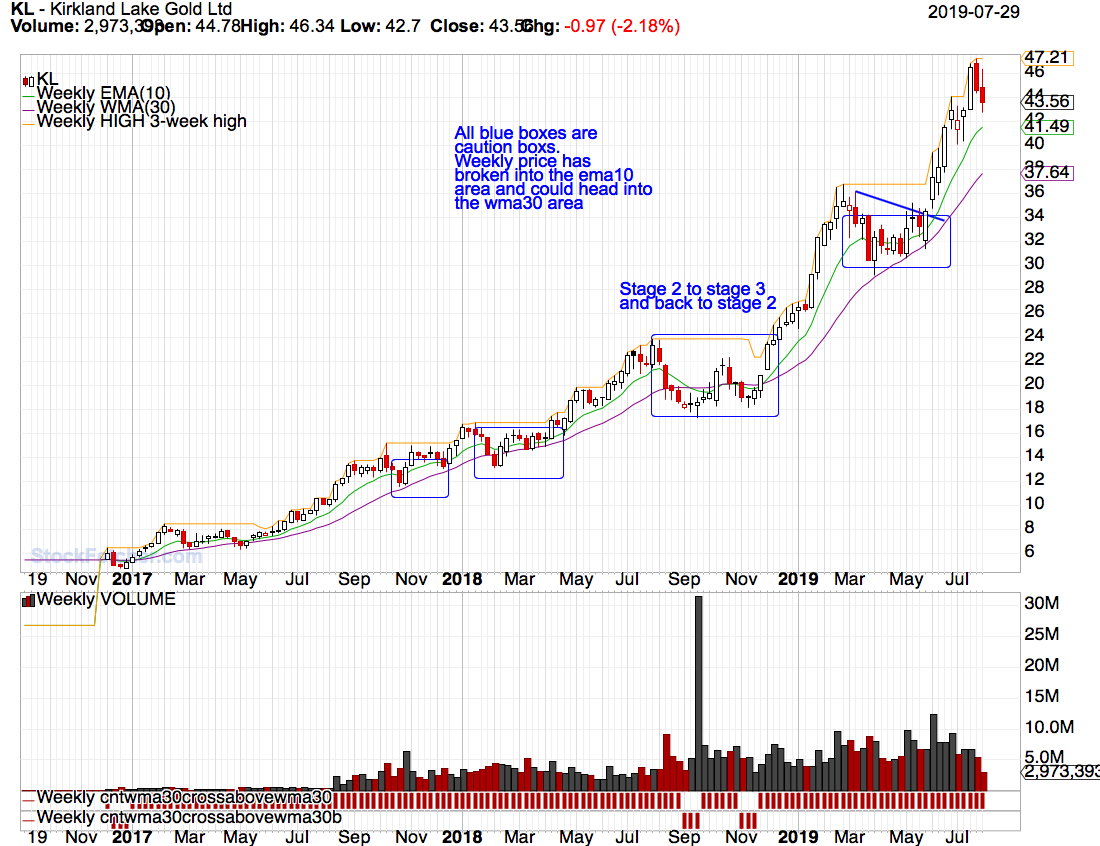
7/31/2019 10:36:55 AM KL is a prime example of s stage 2 going to a stage 3. Then it went back to a stage 2 (buy). KL is still in a stage 2.  Here is a screener that shows KL and the stage its in. http://screener.nextbigtrade.com/#/symbol/kl and group with lots of good info and a couple of posters that give continuation breakout suggestions on a day by day basis. https://stageanalysis.net/forum/forumdisplay.php?fid=1 It might be a great idea of getting the book. Yes it is a old book (1988) and the charts are kinda hard to see but the theory is the same just as the video I posted in this same thread. Its a good add to any investing books library. Mactherriver ( John ) |
| StockFetcher Forums · General Discussion · Stan Weinstein's Secrets For Profiting in Bull and Bear Markets | << 1 ... 4 5 6 7 8 ... 11 >>Post Follow-up |