| StockFetcher Forums · Filter Exchange · A different way of looking at the Guppy Multiple Moving Averages | << 1 2 3 4 5 ... 6 >>Post Follow-up |
| graftonian 1,089 posts msg #154904 - Ignore graftonian |
12/11/2020 6:56:42 PM While discussing dollar cost averaging with a friend, This idea came to me: The Guppy MAs provide a (sort of) howgosit. I propose 2 entrys into a particular stock of ETF; one when the variable CrossCount reaches 6, and another at CrossCount = 11, if warrented. Damn, I wish we had backtesting. Comments? Graf |
| Cheese 1,374 posts msg #154905 - Ignore Cheese |
12/11/2020 7:07:58 PM Thank you, graf. I've always valued your posts and filters on Guppy. Also, one of the Guppy posts most valuable to me is this one from Ed S nibor100 Guppy Investigations https://www.stockfetcher.com/forums/General-Discussion/Guppy-Investigations/144783/-1/144836 nibor100 10/5/2018 1:48:20 PM Guppy Investigation, Case #2, I like looking for crosses of the longest short term avg EMA(15) crossing above the shortest long term avg EMA(30) in the traditional Guppy MMA groupings as indications of new upward separations of the 2 groups.. Mactheriverrat adds a longer term short term avg EMA(17) to some of his Guppy MMA charts and touts the longest short term avg EMA(17) crossing above the shortest long term avg EMA(50) as verification of new upward separations of the 2 groups. I wonder if a. is one more reliable than the other? b. if either or both are triggering too late on some stocks for best possible long trade entries? c. Is some other pair of averages from the 2 groups better? d. If 1 short term avg crossing above 1 long term avg is a reliable indicator of upward group separation for long trade entries; do we even need all of the other averages to be on our charts? Or are they just a visual confidence booster? Ed S. |
| Cheese 1,374 posts msg #154906 - Ignore Cheese |
12/11/2020 7:14:09 PM I believe Ed subsequently confirmed the more importance of EMA 15 and EMA30. Graf called this area the WHITE SPACE. Mac also has some Guppy posts in support of findings by Ed and graf My thanks to all of you for sharing. |
| graftonian 1,089 posts msg #154907 - Ignore graftonian |
12/11/2020 7:39:40 PM @cheese Thanx for the comments. I think this is just another way to look at the info, perhaps one for straight- line kind of people. Since I posted this I find it easier to spot changes buried in the "squiggles". On another topic; For the last 2 months I have been using the higher of PSAR or Guppy 3 day countback. It seems to be working well. Today got stopped out of WIZ after a small gain |
| Cheese 1,374 posts msg #154908 - Ignore Cheese |
12/11/2020 7:52:13 PM Thanks, graf I will study your new info very carefully just like I did with other Guppy material, especially your many excellent Guppy posts and filters Here is the other comment from Ed S nibor100 for SAFER TRADES https://www.stockfetcher.com/sfforums/?mid=145725 nibor100 12/27/2018 8:21:24 AM The basic premise for safer trades with less whipsaws; is that the Ema15 needs to be above the Ema30 before acting on any other indicator. That is the 1st row below the volume part of the chart. Below that I have drawn the standard MACD for a comparison the ema15/ema 30 and below that a line showing the MACD avgs 12 vs 26.. |
| Mactheriverrat 3,178 posts msg #154909 - Ignore Mactheriverrat modified |
12/11/2020 10:29:33 PM Great post Graf and very interesting code!!!!!! AMRS on the tip top of my watchlist on monday. See what happens the first hour to hour and half. A resistance breakout today and should be a good follow through on monday depending on the markets. 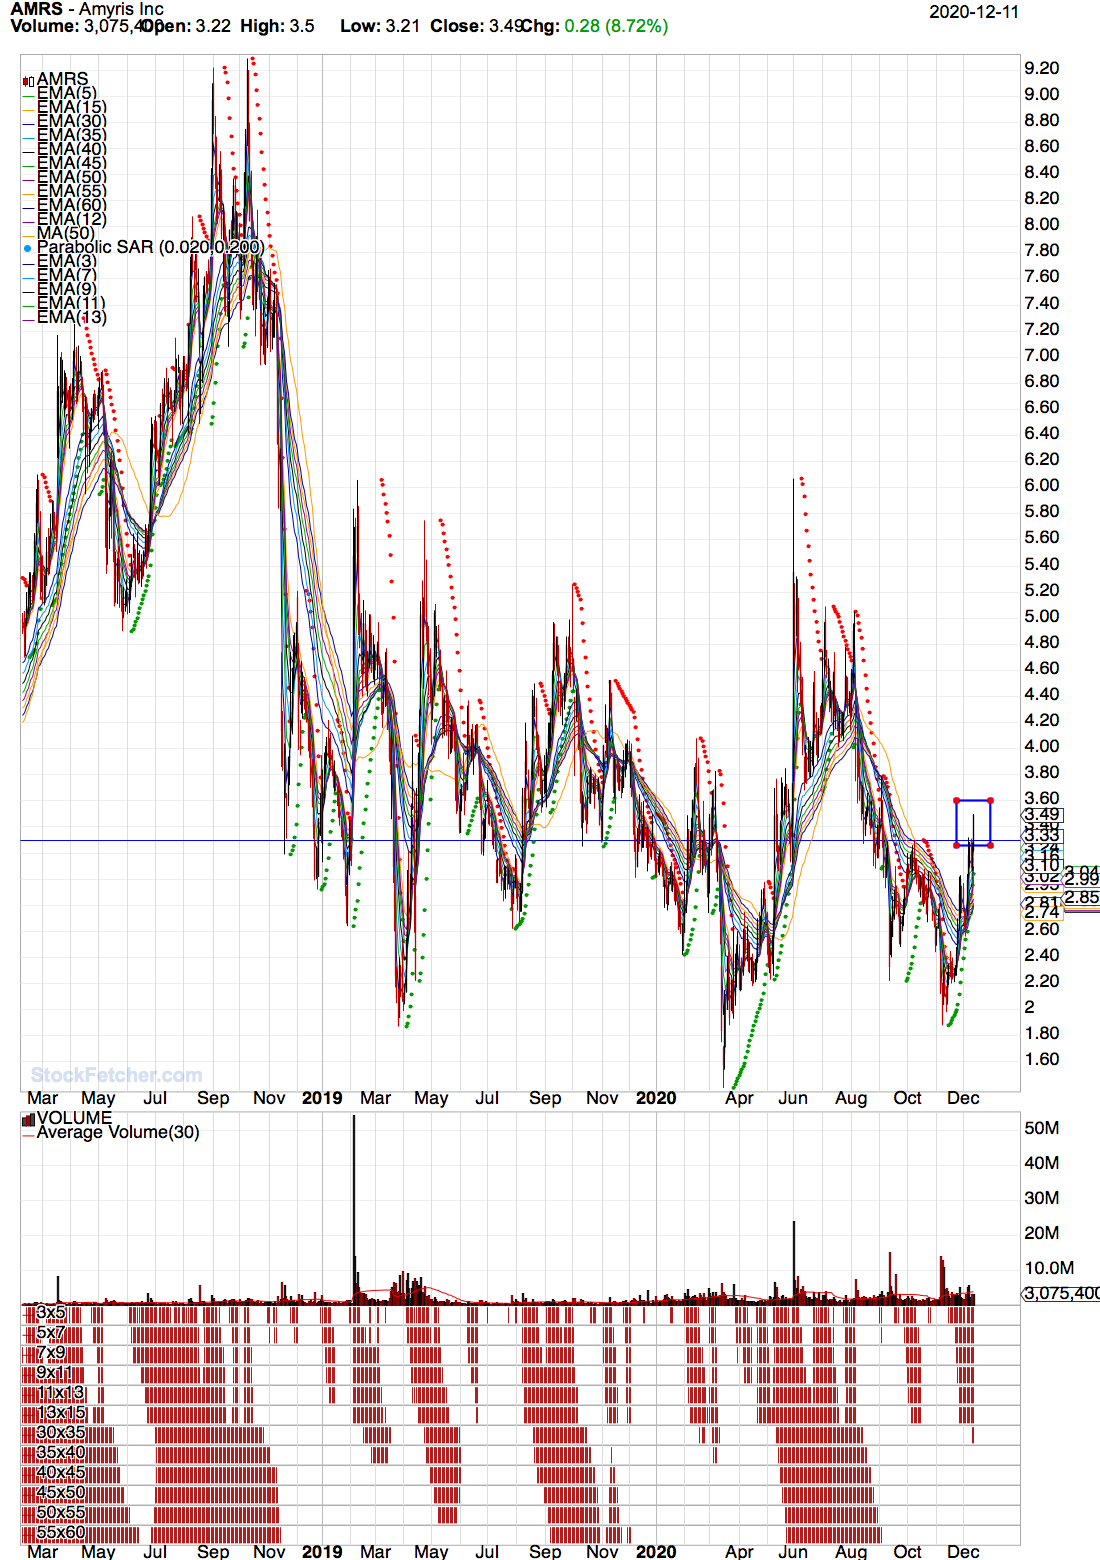 |
| Mactheriverrat 3,178 posts msg #154912 - Ignore Mactheriverrat |
12/11/2020 11:05:48 PM @Cheese You have a great memory of the Ema(17) cross Ema(50) that it's just about the start of that so-called white gap area that seperate's the two Guppy groups. Set{cntema17ema50,count( ema(17) > ema(50) ,1)} draw cntema17ema50 Set{cntema17ema50b,count( ema(17) < ema(50) ,1)} draw cntema17ema50b /* e1750 is number of consecutive days ema(17) above (+)/below(-) previous ema(50) */ set{e1750b,days( ema(17) is above ema(50) ,250)} set{e1750a,days( price is below ema(50) ,250)} set{e1750, e1750a - e1750b} and add column e1750 {e1750} |
| Cheese 1,374 posts msg #154913 - Ignore Cheese |
12/11/2020 11:43:54 PM THANK YOU Mactheriverrat and graftonian. I've learned a lot about Guppys from both of you. My learning and trading objective is to remember only the essential most important things about the Guppys, especially during the heat of the trades. |
| Cheese 1,374 posts msg #154916 - Ignore Cheese |
12/12/2020 2:33:09 PM graf, Your cc10 and CrossCount ideas are excellent guides through all stages of Guppys. THANK YOU, graf, Mac, and Ed S. |
| nibor100 1,103 posts msg #154918 - Ignore nibor100 |
12/12/2020 5:48:46 PM Interesting filter, I need to explore further though I seem to remember that there were only 12 emas in the original Guppy version of multiple MMAs. When I run that filter today the last stock in the results, GFI has a crosscount of 0; and when I draw crosscount and add column crosscount 1 day ago the filter shows GFI with a crosscount of 0 for the prior day. Anybody have a clue what is happening there? Ed S. By the way, for those interested in backtesting, and/or writing their own filters and indicators, and using already written Guppy templates/filters, the program Edgerater Pro 2020 has a current 14 day Free trial. Edgerater is also running one of their rare Lifetime license sales at half price. It is normally a fairly expensive subscription service but is an excellent product and the owner/programmer is an ex Microsoft programmer, so his code executes extremely fast and is super tied to Excel allowing for lots of possibilities. He's got about 100 youtube videos explaining various features of Edgerater and some of the templates. Also, unlike current SF help, if something you want is not currently in the sw or you can't figure out how to do it, he will do his best to make something work for you. Below is the text from his onsite Blog for the Guppy Template release a few years ago. The images would not copy over into this post so you'll have to go to the Edgerater site/Blog to see them. Non members can read all Blog posts and watch all videos and read their Forum posts. Ed S. Guppy Multiple Moving Average Indicator and Template by Chris White | Feb 27, 2017 | Uncategorized | 0 comments The book “Trend Trading, A seven step approach to success” by Daryl Guppy examines in detail the steps in finding, assessing, selecting, managing and monitoring a long-term trend trade. Amazon Book Link: http://a.co/1AMLULl A core part of the approach is the use of a multiple moving average indicator called the Guppy Multiple Moving Average (GMMA) which consists of a series of 6 shorter term exponential moving averages viewed together with a series of 6 longer term exponential moving averages. This indicator helps determine the nature of the trend. Daryl guppy explains that using single moving average crossovers to detect trend entry points is not very successful as different stocks have different characteristics and a ‘one size fits all’ type of approach doesn’t work. Using multiple moving averages arranged into two groups provides more information to inform a better decision. The shorter term group of exponential moving averages is known as the ‘Traders’ group and reflects the more active response that traders have to stock price movement. The longer term group of exponential moving averages is known as the ‘Investors’ group and reflects the actions taken by core position holders and institutions. Here’s an example of the GMMA plotted on a chart: There are several things to watch for to determine the character of a trend: Are the traders above or below the investors? Is there separation between the two groups? Is there compression within a group? Are the moving averages within a group aligned? What is the slope of each group? Compression refers to the individual moving averages within a group coming together as time progresses. Alignment refers to whether the individual moving averages within a group are oriented correctly with respect to each other. For instance, in an uptrend, is the shortest moving average above the next moving average and so on. Actually, Guppy does not refer to alignment in his book but I have found it to be a useful characteristic that helps measure the trend. There are many nuances to trend trading and the book walks the reader through numerous scenarios dealing with breakouts into a new trend and pullbacks within a trend. He shows how you can best determine if a breakout is real or false and how you can tell if a pullback will find support among investors. For people interested in hitching a ride on a trend this book is well worth a read. Of course, once you read the book you will want to apply the GMMA to current charts and scan the market for opportunities. That’s where the new ‘Guppy Multiple Moving Average Template’ comes in. The template is this month’s addition to the ever growing collection of EdgeRater trading templates. Here’s an example of the report produced by the template: It is organized into 3 sections: Bullish Case, Bearish Case and Trader/Investor Measurements. Here’s the Bullish Case section in more detail: You can see in columns H, I and J 3 of the conditions that we are interested in: Traders above investors: ‘Yes’ if the Trader group of MMAs are completely above the Investor group Investors Aligned: ‘Yes’ if all 6 Investor moving averages are aligned, meaning that the shortest MA is above the next shortest and so on. Traders Aligned: ‘Yes’ if all 6 trader moving averages are aligned. The ‘Persistent Uptrend’ column is ‘Yes’ if all 3 of the columns H, I and J are true. Clicking on the header brings all yeses to the top of the list allowing quick access to the charts. The ‘Pullback in Uptrend’ column is ‘Yes’ if Traders are above investors and investors are aligned but traders are not aligned. This attempts to highlight stocks that have firm investor support but are being sold by traders potentially offering better buying opportunities for investors. The ‘Trader/Investor separation’ measures the % difference between the lowest moving average in the traders group and the highest moving average in the investors group. The ‘Bearish Case’ section is the inverse of the bullish case and attempts to locate good shortable downtrending stocks. The final section is the Individual group measurements: Trader Group Width measures the distance in % from the highest to lowest moving average in the Traders group Investor Group Width measures the distance in % from the highest to lowest moving average in the Investors group Trader Average Annualized slope measures the average slope of the trader group of moving averages. This is expressed in annualized % terms meaning that if the slope continued for 1 year the stock would gain the listed % amount Investor Average Annualized slope measures the average slope of the investor group of moving averages. This is expressed in annualized % terms meaning that if the slope continued for 1 year the stock would gain the listed % amount You can filter the slope columns to find stocks that are increasing more steadily or more rapidly. For instance, applying a filter for the investor group slope of between 100% and 300% will show a selection of more steadily rising stocks. The template can be found in the template library under the ‘Hot Topics’ category. To run it, just select the template, select a list of stocks and press Run. Once the report has been produced you can double click on any row to bring up a chart showing the stock. The report is automatically linked to the GMMA chart. If you find a stock to your liking you can click ‘Add To Favorites’ to add it to your own personal watch list for easy access in the future. You can add a note to that entry too. Keeping track of all stocks that you discover in template reports this way allows you to easily remember where they came from and why you liked them. It is a great tool to help you be more successful in your trading. |
| StockFetcher Forums · Filter Exchange · A different way of looking at the Guppy Multiple Moving Averages | << 1 2 3 4 5 ... 6 >>Post Follow-up |