| StockFetcher Forums · Filter Exchange · A different way of looking at the Guppy Multiple Moving Averages | << 1 2 3 4 5 ... 6 >>Post Follow-up |
| VirginTrader 73 posts msg #154919 - Ignore VirginTrader |
12/12/2020 7:38:15 PM Thanks for sharing! Maybe I am getting crossed eyed...seems like there is one line missing...the "35x40"? set{cc7, cc6 + 30x35} set{35x40, count(ema(35) > ema(40), 1)} set{cc8, cc7 + 35x40} set{40x45, count(ema(40) > ema(45), 1)} set{cc9, cc8 + 40x45} set{45x50, count(ema(45) > ema(50), 1)} set{cc10, cc9 + 45x50} set{50x55, count(ema(50) > ema(55), 1)} set{cc11, cc9 + 50x55} set{55x60, count(ema(55) > ema(60), 1)} set{CrossCount, cc11 + 55x60} |
| Mactheriverrat 3,178 posts msg #154920 - Ignore Mactheriverrat |
12/12/2020 9:04:14 PM Correct ema 17 cross ema 50 Set{cntema17ema50,count( ema(17) > ema(50) ,1)} draw cntema17ema50 Set{cntema17ema50b,count( ema(17) < ema(50) ,1)} draw cntema17ema50b /* e1750 is number of consecutive days ema(17) above (+)/below(-) previous ema(50) */ set{e1750b,days( ema(17) is above ema(50) ,250)} set{e1750a,days( ema(17) is below ema(50) ,250)} set{e1750, e1750a - e1750b} and add column e1750 {e1750} |
| Cheese 1,374 posts msg #154921 - Ignore Cheese |
12/12/2020 10:03:30 PM Thank you, everyone |
| Mactheriverrat 3,178 posts msg #154922 - Ignore Mactheriverrat |
12/12/2020 11:05:08 PM @graf Been playing around with you code all day today . Very interesting how the trader's (lower ema group) group crossover's happen which lead into the the investor's group rolling over. Thanks for posting this thread. Very interesting indeed! Mac. Then again my real name in John. |
| graftonian 1,089 posts msg #154925 - Ignore graftonian |
12/13/2020 12:44:00 PM @Mac (or John) "Very interesting how the trader's (lower ema group) group crossover's happen which lead into the the investor's group rolling over." Consider the fact that the trader group is only 2 days apart, and the investor group is 5 days apart. The cross-overs are bound to happen more often. I'm trying to work up a better "white space" indicator between the ema15 and ema30 Graf (Duane) |
| graftonian 1,089 posts msg #154926 - Ignore graftonian |
12/13/2020 1:58:21 PM Originally, I was trying to keep trader and investor groups separate, added and modified a few lines: set{traXinv, count(ema(15) > ema(30), 1)} draw traXinv set{cc6a, cc6 + traXinv} set{30x35, count(ema(30) > ema(35), 1)} draw 30x35 set{cc7, cc6a + 30x35} ...and change the trigger to crosscount = 7 Duane |
| Mactheriverrat 3,178 posts msg #154927 - Ignore Mactheriverrat |
12/13/2020 2:16:52 PM Roger that Duane!!!! I assume you seen Virgin trader catch on the code and Cheese fix of it. I also sometimes post code and then see I didn't have it right. I like seeing the cross count on on the charts. I like how the traders group crossover's give's warning signs of at least the trader's group is changing up or down. The investor's group if its strong trend still and the trader's group starts to rollback up then it up trending again and new highs. You know with every filter people will add code to it but if helps to the user's own liking the so be it . On mine I added: draw high 4 week high Set{cntema10ema50,count( ema(10) > ema(50) ,1)} draw cntema10ema50 Set{cntema10ema50b,count( ema(10) < ema(50) ,1)} draw cntema10ema50b /* e1050 is number of consecutive days ema(10) above (+)/below(-) previous ema(50) */ set{e1050b,days( ema(10) is above ema(50) ,250)} set{e1050a,days( ema(17) is below ema(50) ,250)} set{e1050, e1050a - e1050b} and add column e1050 {e1050} Thanks to All!!!!!! |
| Mactheriverrat 3,178 posts msg #154928 - Ignore Mactheriverrat |
12/13/2020 2:25:24 PM BTW i- On my filters I'm calling the "Graf's Guppy system stragety " AMWL - On my watchlist in the morning 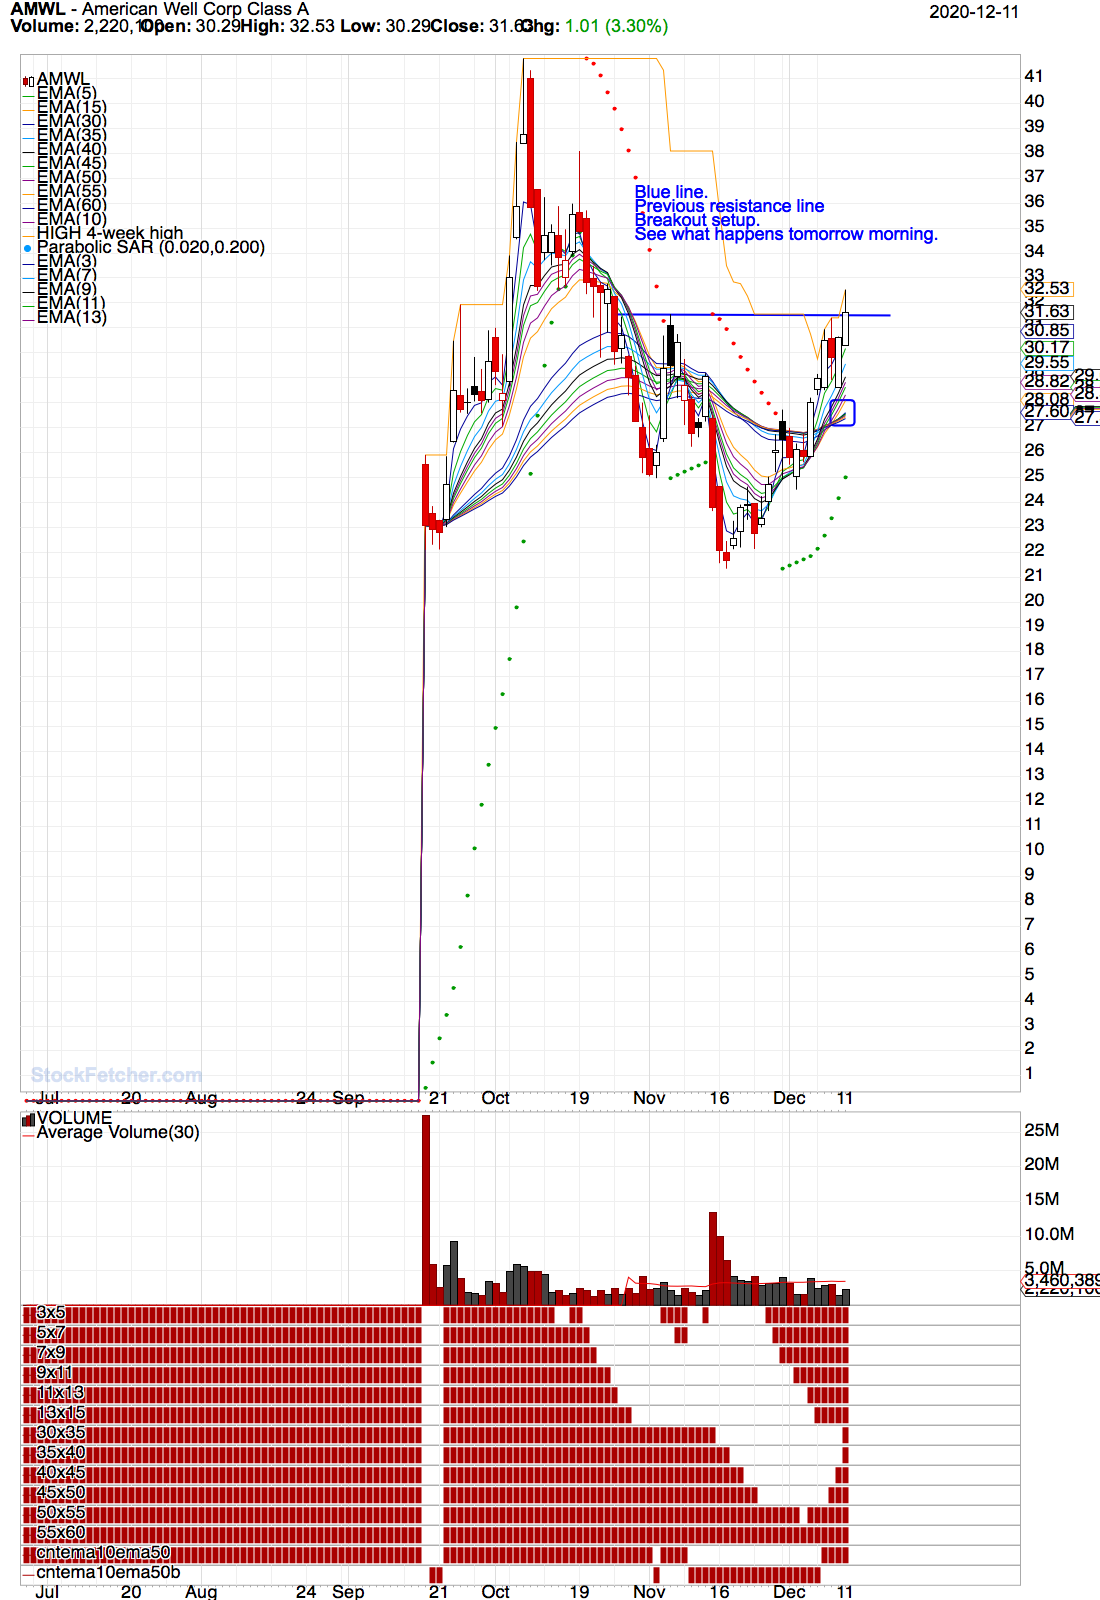 |
| graftonian 1,089 posts msg #154929 - Ignore graftonian |
12/13/2020 3:52:04 PM Question: Is the ema15-30 cross an indication of things going right? I, personally think so; but sure helps to have PSAR on your side and be above the MA200. Duane |
| Cheese 1,374 posts msg #154930 - Ignore Cheese |
12/13/2020 4:05:18 PM Thank you, John(Mac) and Duane(graf) for the additional explanations and information. "Mactheriverrat" and "graftonian" are more famous and easier to search, especially when I have to use Google to search Stockfetcher forum posts. So, when Mac said " very interesting how the trader's (lower ema group) group crossover's happen which lead into the the investor's group rolling over" and "I like seeing the cross count on on the charts. I like how the traders group crossover's give's warning signs of at least the trader's group is changing up or down. The investor's group if its strong trend still and the trader's group starts to rollback up then it up trending again and new highs." are you looking for some sort of Hour Glass shape just forming from graf's Traders and Investors histogram bars? |
| StockFetcher Forums · Filter Exchange · A different way of looking at the Guppy Multiple Moving Averages | << 1 2 3 4 5 ... 6 >>Post Follow-up |