StockFetcher Forums · Filter Exchange · A different way of looking at the Guppy Multiple Moving Averages<< 1 2 3 4 5 ... 6 >>Post Follow-up
graftonian
1,089 posts
msg #154932
Ignore graftonian
12/13/2020 4:45:33 PM

@Cheese
I'd describe it as a half wineglass, but yes. NOG on friday is a good example

Cheese
1,374 posts
msg #154933
Ignore Cheese
modified
12/13/2020 5:16:54 PM

okay, graf. Thanks. I'd be looking for NOG and Half Wine Glass

Thank you also for the 15x30, psar, and above 200ma,

Mactheriverrat
3,130 posts
msg #154934
Ignore Mactheriverrat
12/13/2020 5:50:15 PM

A tale of the charts.

Remember in that Guppy Video when both groups of averages are intertwined that they are in a state of flux. Its when they finally separate from each other that the magic happens but even after the turn in one direction or another that both groups must finish rolling over.

NOG and CDEV of this. Ema 15 / 30 cross , ema 17 / 50 cross or even a ema 15 cross ema 60 cross which one would think would be the seperation of the two Guppy groups for that matter that the trend change can fail or succeed.
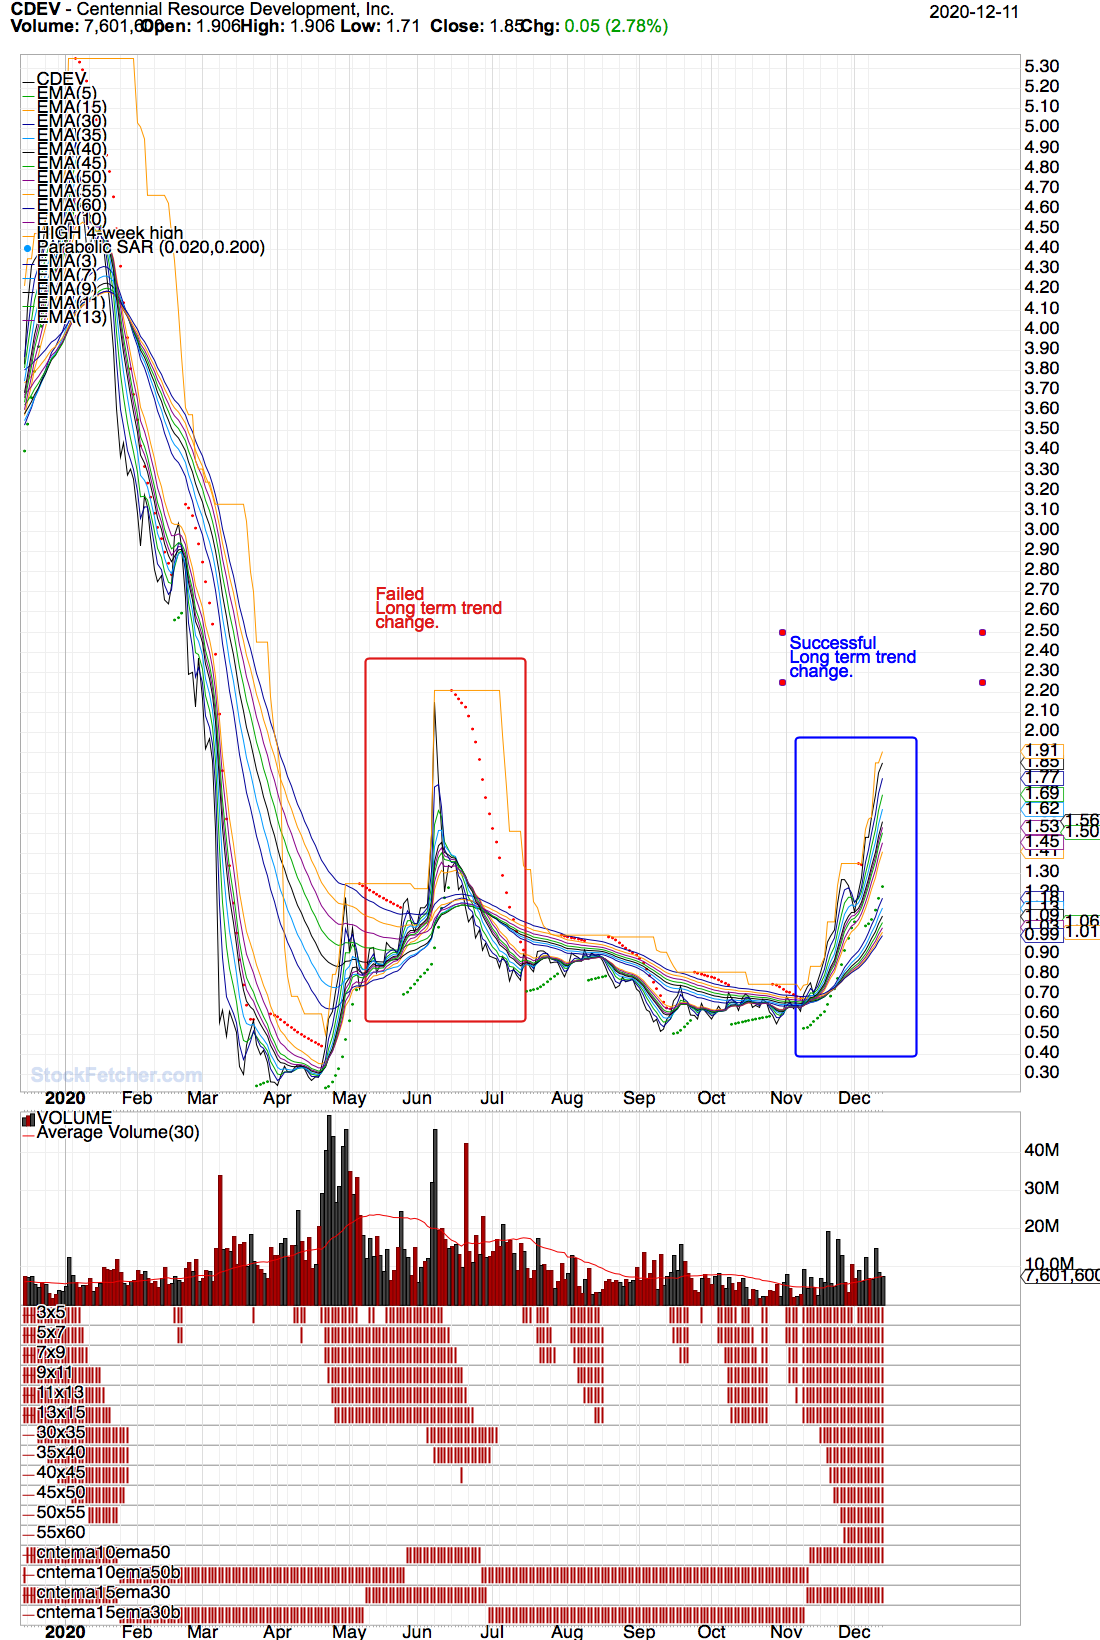


Mactheriverrat
3,130 posts
msg #154935
Ignore Mactheriverrat
modified
12/13/2020 5:55:14 PM

Meaning even one should be on watch after the two groups separate for first signs of weakness in the short term group while the longer term group continues to finishing rolling over.


Cheese
1,374 posts
msg #154936
Ignore Cheese
12/13/2020 6:41:10 PM

Thank you, graf and Mac for your added suggestions of Dec 13, 2020

Fetcher[

chart-time is 12 months
not otcbb
average volume(30) > 1234567
close > .50


draw Parabolic SAR(0.02,0.2)


/** The Filter **/
CrossCount > CrossCount 1 day ago /*detect a change*/
close 1 day ago > Parabolic SAR(0.02,0.2) /*general health*/
close < close 1 day ago * 1.10 /*avoid gap-up*/
volume 1 day ago > Average Volume(30) * 1.15 /*above average interest*/

/*Standard Guppy Averages*/
draw ema(3)
draw ema(5)
draw ema(7)
draw ema(9)
draw ema(11)
draw ema(13)
draw ema(15)
draw ema(30)
draw ema(35)
draw ema(40)
draw ema(45)
draw ema(50)
draw ema(55)
draw ema(60)

/*Identify when each pair of MAs cross and sum the crosses */
set{3x5, count(ema(3) > ema(5), 1)}
draw 3x5
set{cc1, 3x5}

set{5x7, count(ema(5) > ema(7), 1)}
draw 5x7
set{cc2, cc1 + 5x7}

set{7x9, count(ema(7) > ema(9), 1)}
draw 7x9
set{cc3, cc2 + 7x9}

set{9x11, count(ema(9) > ema(11), 1)}
draw 9x11
set{cc4, cc3 + 9x11}

set{11x13, count(ema(11) > ema(13), 1)}
draw 11x13
set{cc5, cc4 + 11x13}

set{13x15, count(ema(13) > ema(15), 1)}
draw 13x15
set{cc6, cc5 + 13x15}


/* ============================================================================== */
/* graftonian Dec 13, 2020 */
set{traXinv, count(ema(15) > ema(30), 1)}
draw traXinv /* graftonian's Dec 13, 2020 traXinv is stem of Half Wine Glass (full of traders mMAs) */

set{cc6a, cc6 + traXinv}

set{30x35, count(ema(30) > ema(35), 1)}
draw 30x35
/* set{cc7, cc6 + 30x35} */
set{cc7, cc6a + 30x35}
/* =============================================================================== */


set{35x40, count(ema(35) > ema(40), 1)}
draw 35x40
set{cc7_35x40, cc7 + 35x40} /* CORRECTED FOR OMISSION */

set{40x45, count(ema(40) > ema(45), 1)}
draw 40x45
set{cc8, cc7_35x40 + 40x45} /* CORRECTED FOR OMISSION */

set{45x50, count(ema(45) > ema(50), 1)}
draw 45x50
set{cc9, cc8 + 45x50}

set{50x55, count(ema(50) > ema(55), 1)}
draw 50x55
set{cc10, cc9 + 50x55}

set{55x60, count(ema(55) > ema(60), 1)}
draw 55x60
set{CrossCount, cc10 + 55x60}

add column CrossCount /* graftonian's CrossCount with Dec 13, 2020 traXinv */
sort on column 5 descending
/* do not draw CrossCount */


add column cc10 /* graftonian's cc10 with Dec 13, 2020 traXinv */


/* =============================================================================== */
/* Mactheriverrat Dec 13, 2020 */

draw high 4 week high
Set{cntema10ema50,count( ema(10) > ema(50) ,1)}
draw cntema10ema50

Set{cntema10ema50b,count( ema(10) < ema(50) ,1)}

draw cntema10ema50b

/* e1050 is number of consecutive days ema(10) above (+)/below(-) previous ema(50) */
set{e1050b,days( ema(10) is above ema(50) ,250)}
set{e1050a,days( ema(17) is below ema(50) ,250)}
set{e1050, e1050a - e1050b} and add column e1050 {e1050}
/* =============================================================================== */

/* =============================================================================== */
/* Mactheriverrat Dec 12, 2020 */

/* importance of ema 17 per Mactheriverrat */
Set{cntema17ema50,count( ema(17) > ema(50) ,1)}
draw cntema17ema50

Set{cntema17ema50b,count( ema(17) < ema(50) ,1)}

draw cntema17ema50b

/* e1750 is number of consecutive days ema(17) above (+)/below(-) previous ema(50) */
set{e1750b,days( ema(17) is above ema(50) ,250)}
set{e1750a,days( ema(17) is below ema(50) ,250)}
set{e1750, e1750a - e1750b} and add column e1750 {e1750}
/* =============================================================================== */

]


Cheese
1,374 posts
msg #154937
Ignore Cheese
12/13/2020 6:56:53 PM

Thank you, graf and Mac for your added suggestions of Dec 13, 2020
I draw cc6 so I can see the Half Wine Glass better

Fetcher[

chart-time is 6 months
not otcbb
average volume(30) > 1234567
close > .50


draw Parabolic SAR(0.02,0.2)


/** The Filter **/
CrossCount > CrossCount 1 day ago /*detect a change*/
close 1 day ago > Parabolic SAR(0.02,0.2) /*general health*/
close < close 1 day ago * 1.10 /*avoid gap-up*/
volume 1 day ago > Average Volume(30) * 1.15 /*above average interest*/

/*Standard Guppy Averages*/
draw ema(3)
draw ema(5)
draw ema(7)
draw ema(9)
draw ema(11)
draw ema(13)
draw ema(15)
draw ema(30)
draw ema(35)
draw ema(40)
draw ema(45)
draw ema(50)
draw ema(55)
draw ema(60)

/*Identify when each pair of MAs cross and sum the crosses */
set{3x5, count(ema(3) > ema(5), 1)}
draw 3x5
set{cc1, 3x5}

set{5x7, count(ema(5) > ema(7), 1)}
draw 5x7
set{cc2, cc1 + 5x7}

set{7x9, count(ema(7) > ema(9), 1)}
draw 7x9
set{cc3, cc2 + 7x9}

set{9x11, count(ema(9) > ema(11), 1)}
draw 9x11
set{cc4, cc3 + 9x11}

set{11x13, count(ema(11) > ema(13), 1)}
draw 11x13
set{cc5, cc4 + 11x13}

set{13x15, count(ema(13) > ema(15), 1)}
draw 13x15
set{cc6, cc5 + 13x15}


DRAW CC6 /* I added this to see the Half Wine Glass better */


/* ============================================================================== */
/* graftonian Dec 13, 2020 */
set{traXinv, count(ema(15) > ema(30), 1)}
draw traXinv /* graftonian's Dec 13, 2020 traXinv is like beginning of stem of Half Wine Glass (full of traders mMAs) */

set{cc6a, cc6 + traXinv}

set{30x35, count(ema(30) > ema(35), 1)}
draw 30x35
/* set{cc7, cc6 + 30x35} */
set{cc7, cc6a + 30x35}
/* =============================================================================== */


set{35x40, count(ema(35) > ema(40), 1)}
draw 35x40
set{cc7_35x40, cc7 + 35x40} /* CORRECTED FOR OMISSION */

set{40x45, count(ema(40) > ema(45), 1)}
draw 40x45
set{cc8, cc7_35x40 + 40x45} /* CORRECTED FOR OMISSION */

set{45x50, count(ema(45) > ema(50), 1)}
draw 45x50
set{cc9, cc8 + 45x50}

set{50x55, count(ema(50) > ema(55), 1)}
draw 50x55
set{cc10, cc9 + 50x55}

set{55x60, count(ema(55) > ema(60), 1)}
draw 55x60
set{CrossCount, cc10 + 55x60}

add column CrossCount /* graftonian's CrossCount with Dec 13, 2020 traXinv */
sort on column 5 descending
/* do not draw CrossCount */


add column cc10 /* graftonian's cc10 with Dec 13, 2020 traXinv */


/* =============================================================================== */
/* Mactheriverrat Dec 13, 2020 */

draw high 4 week high
Set{cntema10ema50,count( ema(10) > ema(50) ,1)}
draw cntema10ema50

Set{cntema10ema50b,count( ema(10) < ema(50) ,1)}

draw cntema10ema50b

/* e1050 is number of consecutive days ema(10) above (+)/below(-) previous ema(50) */
set{e1050b,days( ema(10) is above ema(50) ,250)}
set{e1050a,days( ema(17) is below ema(50) ,250)}
set{e1050, e1050a - e1050b} and add column e1050 {e1050}
/* =============================================================================== */

/* =============================================================================== */
/* Mactheriverrat Dec 12, 2020 */

/* importance of ema 17 per Mactheriverrat */
Set{cntema17ema50,count( ema(17) > ema(50) ,1)}
draw cntema17ema50

Set{cntema17ema50b,count( ema(17) < ema(50) ,1)}

draw cntema17ema50b

/* e1750 is number of consecutive days ema(17) above (+)/below(-) previous ema(50) */
set{e1750b,days( ema(17) is above ema(50) ,250)}
set{e1750a,days( ema(17) is below ema(50) ,250)}
set{e1750, e1750a - e1750b} and add column e1750 {e1750}
/* =============================================================================== */

]


shillllihs
5,960 posts
msg #154938
Ignore shillllihs
12/13/2020 9:12:44 PM

Post your e-mails and I’ll tell you how to eliminate 90% of those losing red on these lists and give you 5 or 6 green a day.

Mactheriverrat
3,130 posts
msg #154939
Ignore Mactheriverrat
modified
12/13/2020 9:19:29 PM

@shilllihs
Why not just how to do it.

shillllihs
5,960 posts
msg #154940
Ignore shillllihs
12/13/2020 10:05:02 PM

Price is below median bollinger band(20)
Results start looking good a month back. Will limit results but win rate may improve.

nibor100
1,008 posts
msg #154942
Ignore nibor100
12/14/2020 4:34:26 AM

1. This line from some of the filters above does not do what some of you may think it does:

close < close 1 day ago * 1.10

If I change it to

close < close 1 day ago * -10

I get the exact same number of results.

Primarily because SF is ignoring everything after "ago"

2. So once that line is adjusted for; there is probably no need to add a line with the 20 period simple moving average to a filter that is using exponential moving averages.

Ed S.


StockFetcher Forums · Filter Exchange · A different way of looking at the Guppy Multiple Moving Averages<< 1 2 3 4 5 ... 6 >>Post Follow-up

*** Disclaimer *** StockFetcher.com does not endorse or suggest any of the securities which are returned in any of the searches or filters. They are provided purely for informational and research purposes. StockFetcher.com does not recommend particular securities. StockFetcher.com, Vestyl Software, L.L.C. and involved content providers shall not be liable for any errors or delays in the content, or for any actions taken based on the content.


Copyright 2022 - Vestyl Software L.L.C.Terms of Service | License | Questions or comments? Contact Us
EOD Data sources: DDFPlus & CSI Data Quotes delayed during active market hours. Delay times are at least 15 mins for NASDAQ, 20 mins for NYSE and Amex. Delayed intraday data provided by DDFPlus


This site is protected by reCAPTCHA and the Google Privacy Policy and Terms of Service apply.