| StockFetcher Forums · Stock Picks and Trading · Intraday Alerts | << 1 ... 1388 1389 1390 1391 1392 ... 1903 >>Post Follow-up |
| Eman93 4,750 posts msg #125183 - Ignore Eman93 |
9/23/2015 12:17:19 AM Eman93 msg #124872 9/8/2015 9:04:26 PM Looking at many many charts and running filters on the bearish 50day cross below the 200day you almost always get a rally up into resistance after the cross, most of the time its the test of the 50 or 100 day. --------------------------- The charts are on sell that is just a fact and i try to deal with facts. |
| Eman93 4,750 posts msg #125184 - Ignore Eman93 modified |
9/23/2015 12:22:56 AM Jp your trending question, On daily time frame. Trending up above 50 day, 20 day would be above 50 day. Would like to have price above the 200 day also. Making higher lows. Bear just flip it. |
| Mactheriverrat 3,178 posts msg #125185 - Ignore Mactheriverrat |
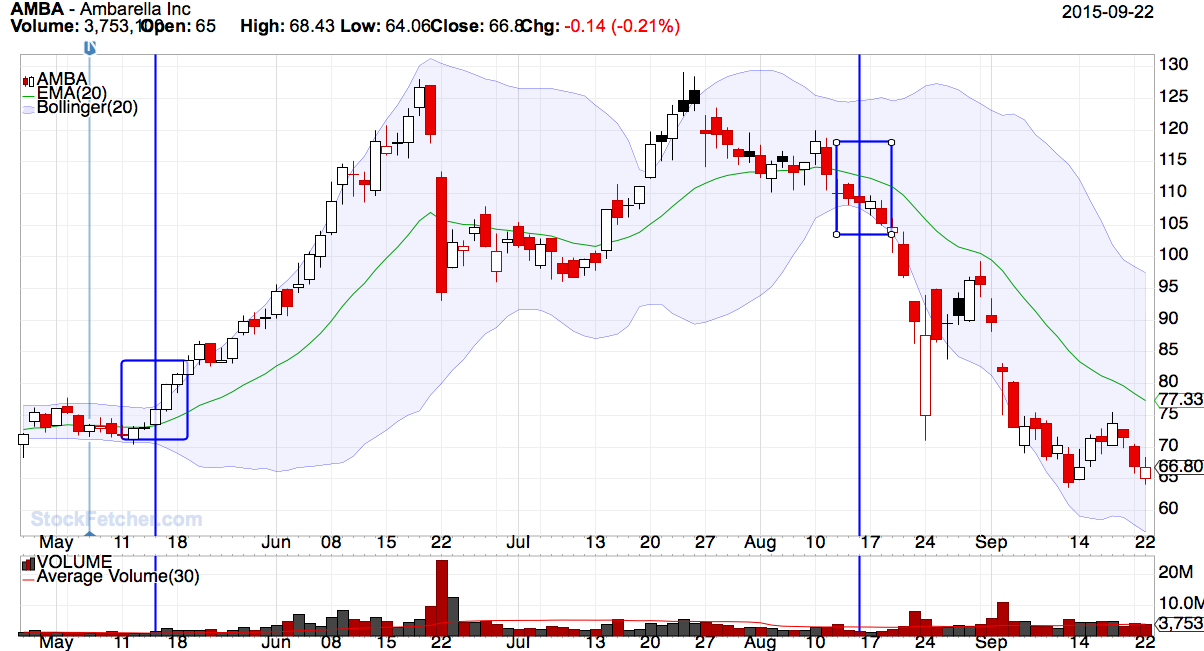
9/23/2015 4:13:30 AM Trending to me is the EMA(20) moving up from a down trend ( sort column DxD for ema(20) and the upper Bollinger band expanding day one (sort column AxA for upper bollinger band) , BxB is the lower bollinger band movement . One can change the filter to suit their needs like say EMA(20) is below EMA(20) one day ago different volume , different average day range(30) Trending up filter below Submit |
| Mactheriverrat 3,178 posts msg #125186 - Ignore Mactheriverrat |
9/23/2015 4:22:31 AM AMBA stock - first line EMA(20) trending up and upper Bollinger band moving up day one 5-14-2015 Second line EMA(20) trending down and lower Bollinger band moving down day one. 8-14-2015  |
| karennma 8,057 posts msg #125189 - Ignore karennma |
9/23/2015 8:02:06 AM Good morning. Re: johnpaulca 9,029 posts msg #125181 - Ignore johnpaulca modified 9/22/2015 11:14:47 PM Karen or anyone....how do you decide when a stock is trending or not in your time frame? ================================================================ Just a straight line ... higher highs to higher highs, or lower lows to lower lows. Or you can use linear regression channels in any time-frame. Sorry I don't know how to post pictures of charts. (One of these days I'll figure it out. LOL!) |
| karennma 8,057 posts msg #125190 - Ignore karennma modified |
9/23/2015 8:34:39 AM Straight lines tell me what I want to know.  Edit: How do I make the chart bigger? Why are everyone else's charts so clear & mine is fuzzy? I can barely see the daRn thing. |
| karennma 8,057 posts msg #125191 - Ignore karennma |
9/23/2015 9:03:47 AM Here's what I posted before AMBA earnings .... ******************* karennma 5,466 posts msg #124815 8/31/2015 2:02:50 PM AMBA -- Hate to say it, but ... Everyone is so positive on their earnings, I wouldn't be surprised if MMs try to screw everyone and AMBA goes down instead of up. There will be some BS excuse like, "guidance" fell short or they'll meet expectations, but not "beat", or they met revenue but didn't exceed. Blah blah blah ... After last Monday, I don't trust 'em. JMHO. karennma 5,466 posts msg #124818 8/31/2015 3:35:36 PM Therefore. reduced my position in AMBA. The "surprise" might be a nightmare. ***************************** I could see it coming. Even reduced my position size. One more mistake like this, & I'll be working at WalMart. |
| karennma 8,057 posts msg #125192 - Ignore karennma |
9/23/2015 9:18:23 AM johnpaulca 9,029 posts msg #125181 - Ignore johnpaulca modified 9/22/2015 11:14:47 PM Karen or anyone....how do you decide when a stock is trending or not in your time frame? ======================== JP, When are you going to share with us YOUR secret? You have an uncanny ability to pinpoint tops, bottoms and price targets. Care to share? :>) |
| johnpaulca 12,036 posts msg #125193 - Ignore johnpaulca |
9/23/2015 9:29:40 AM Thanks for sharing guys. Karen.....wish I had a secret formula...lol. My trading is quite simple, keep on the right side of the market....most of the times. Stay in the trend buy the pullback and don't overstay your welcome(scalp). |
| johnpaulca 12,036 posts msg #125194 - Ignore johnpaulca |
9/23/2015 9:44:46 AM MPC($47)....when this breaks out it could fly, nice consolidation. |
| StockFetcher Forums · Stock Picks and Trading · Intraday Alerts | << 1 ... 1388 1389 1390 1391 1392 ... 1903 >>Post Follow-up |