| StockFetcher Forums · Stock Picks and Trading · CF | << 1 2 >>Post Follow-up |
| Mactheriverrat 3,178 posts msg #141446 - Ignore Mactheriverrat |
1/28/2018 5:44:39 AM 1st day of the cma(DMA(8,-5),8) above cma(DMA(8,-5),8) one day ago. 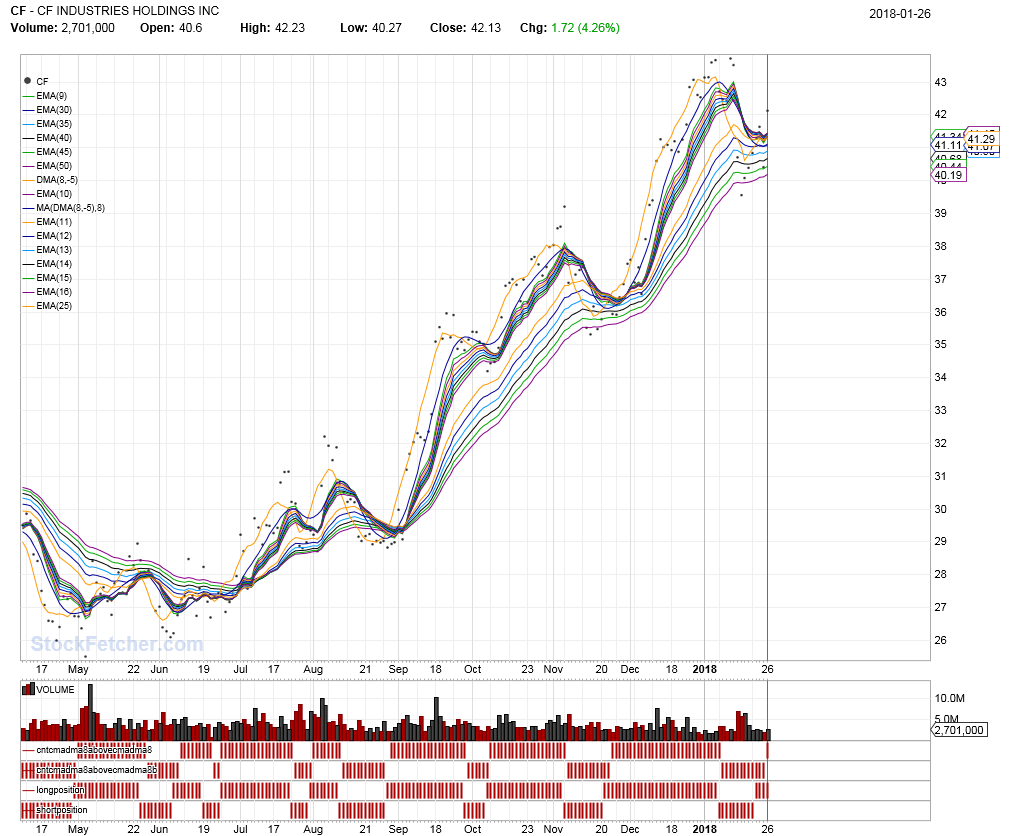 |
| davesaint86 726 posts msg #141447 - Ignore davesaint86 |
1/28/2018 9:15:28 AM Mac - So a buy would be when the dma8 crosses above the shorter ema guppy group and a sell would be when the dma touches the shorter ema guppy group? It's looks like it would work. |
| Cheese 1,374 posts msg #141448 - Ignore Cheese |
1/28/2018 10:42:46 AM Looks good. Thank you, Mac and Dave. |
| 15minofPham 171 posts msg #141449 - Ignore 15minofPham |
1/28/2018 12:26:43 PM Mac, How do you have the chart show that long pink line? Thanks! |
| Mactheriverrat 3,178 posts msg #141451 - Ignore Mactheriverrat modified |
1/28/2018 1:17:48 PM @Dave just studying this to see how the cma(DMA(8,-5),8) is above cma(DMA(8,-5),8) one day ago as a trigger. I've seen many a filters from Run Forrest Run to 13th_floors Deadly combo but there seems to be a lose on what the triggers are when these filters are posted . On a side note the modified Guppy Moving averages are nice to know but they too are more lagging indicators . Maybe I should just have one long term moving average showing longer term trends. IMHO. @chesse In the chart popup menu's one can draw trend lines any which ways and all you have to do is change the color. Submit |
| Cheese 1,374 posts msg #141452 - Ignore Cheese |
1/28/2018 1:22:43 PM Thanks again, Mac! |
| karennma 8,057 posts msg #141453 - Ignore karennma |
1/28/2018 1:28:01 PM 15minofPham 60 posts msg #141449 - Ignore 15minofPham 1/28/2018 12:26:43 PM Mac, How do you have the chart show that long pink line? Thanks! ====================================== I had that same question 2 weeks ago. I still can't draw any lines unless I write a filter to do so. I have no clue why the drawing tools aren't working like they used to. Nevertheless ... back to the VERTICAL LINE ... |
| Mactheriverrat 3,178 posts msg #141455 - Ignore Mactheriverrat |
1/28/2018 2:03:55 PM The pop up charts and hit the vertical line , then hit the default color which is Blue and one can change to any color they like. |
| 15minofPham 171 posts msg #141457 - Ignore 15minofPham |
1/28/2018 3:18:02 PM What is the verbiage to use in a filter if I want to draw a line each time an occurrence happen? ie Every time there's a bullish MACD X-Over? Wish SF allow you to write a filter to show gain each time there's a such a X-Over. |
| karennma 8,057 posts msg #141460 - Ignore karennma |
1/28/2018 4:17:20 PM @ Mac, Ohhhhh! Holy smokes! That was easy! Thanks! |
| StockFetcher Forums · Stock Picks and Trading · CF | << 1 2 >>Post Follow-up |