| StockFetcher Forums · Stock Picks and Trading · A Newbie's Journey | << 1 ... 38 39 40 41 42 ... 48 >>Post Follow-up |
| sandjco 648 posts msg #147747 - Ignore sandjco |
5/9/2019 11:53:52 AM Spoke too soon I guess. Opened SQQQ and SMH puts at open but will use EOD. Since I'm a virgin with options as well...in hindsight, maybe my stop should have been at 50% and letting the profits run but with stops in place. Who knows if this retracement will be like the one in late 2018 which was lit by another Trump tweet? |
| sandjco 648 posts msg #147760 - Ignore sandjco |
5/10/2019 8:21:22 AM SQQQ  SMH 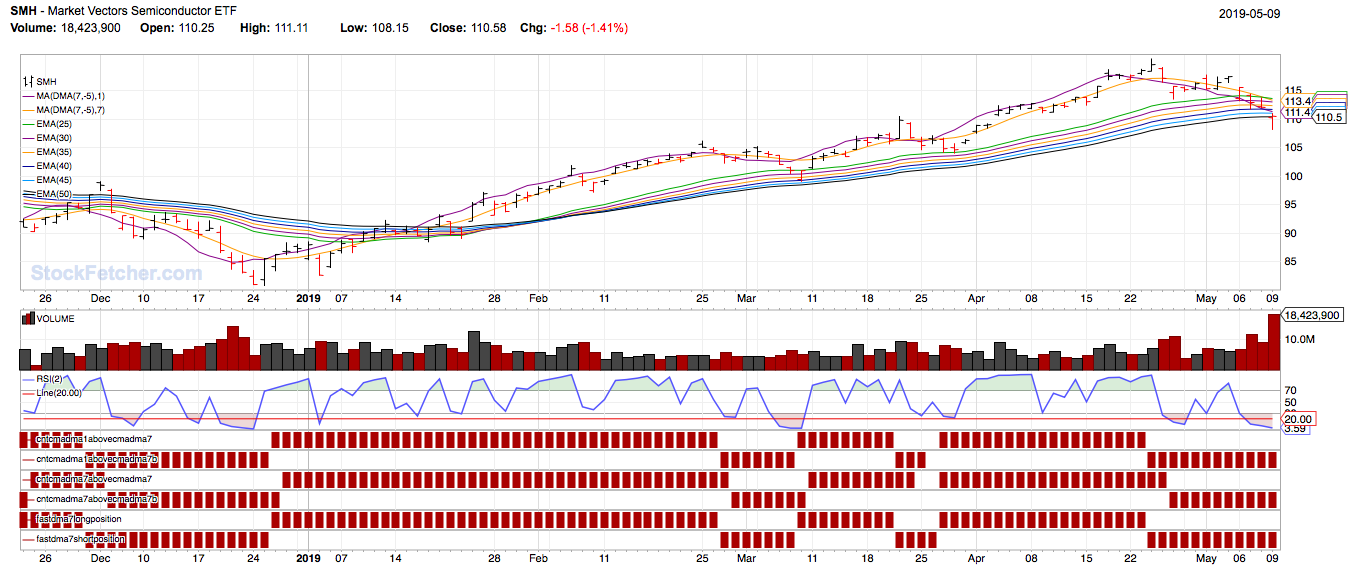 Maybe I read the tea leaves wrong... |
| sandjco 648 posts msg #147787 - Ignore sandjco modified |
5/14/2019 8:26:26 AM There she goes... 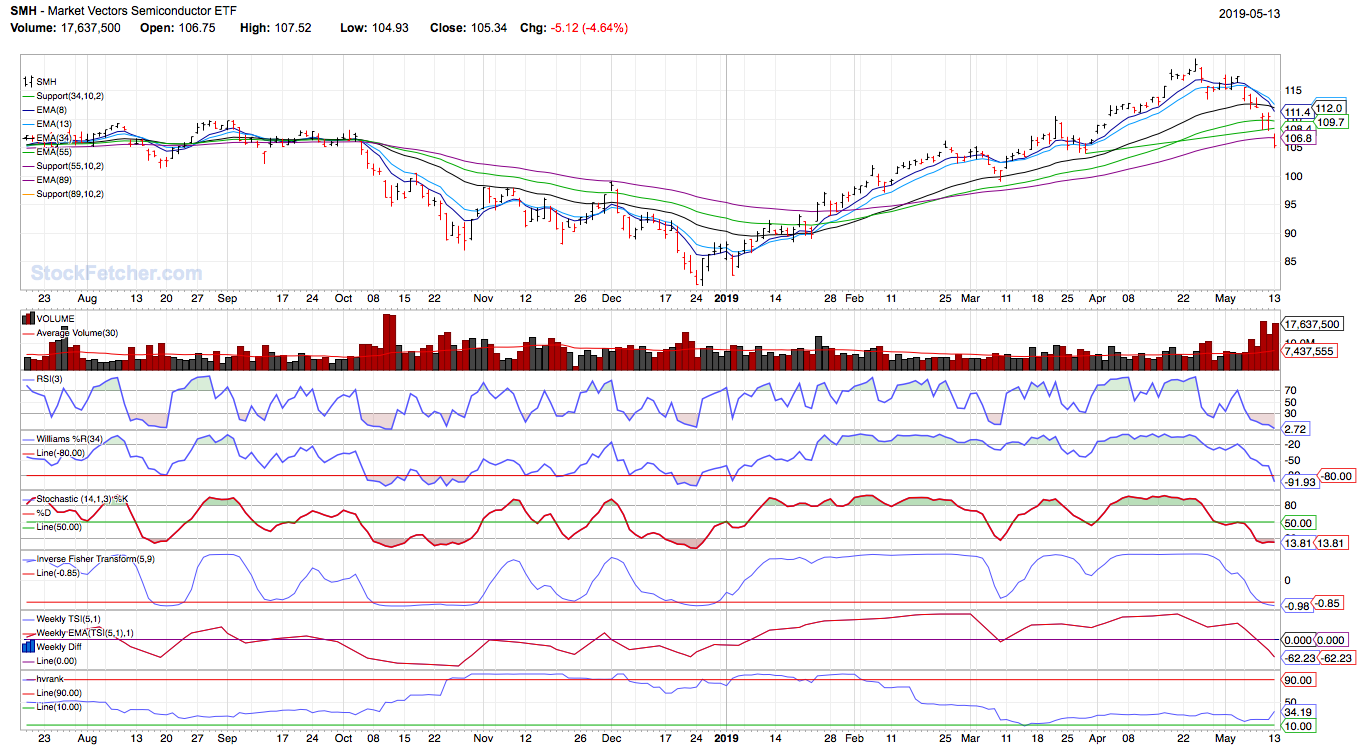 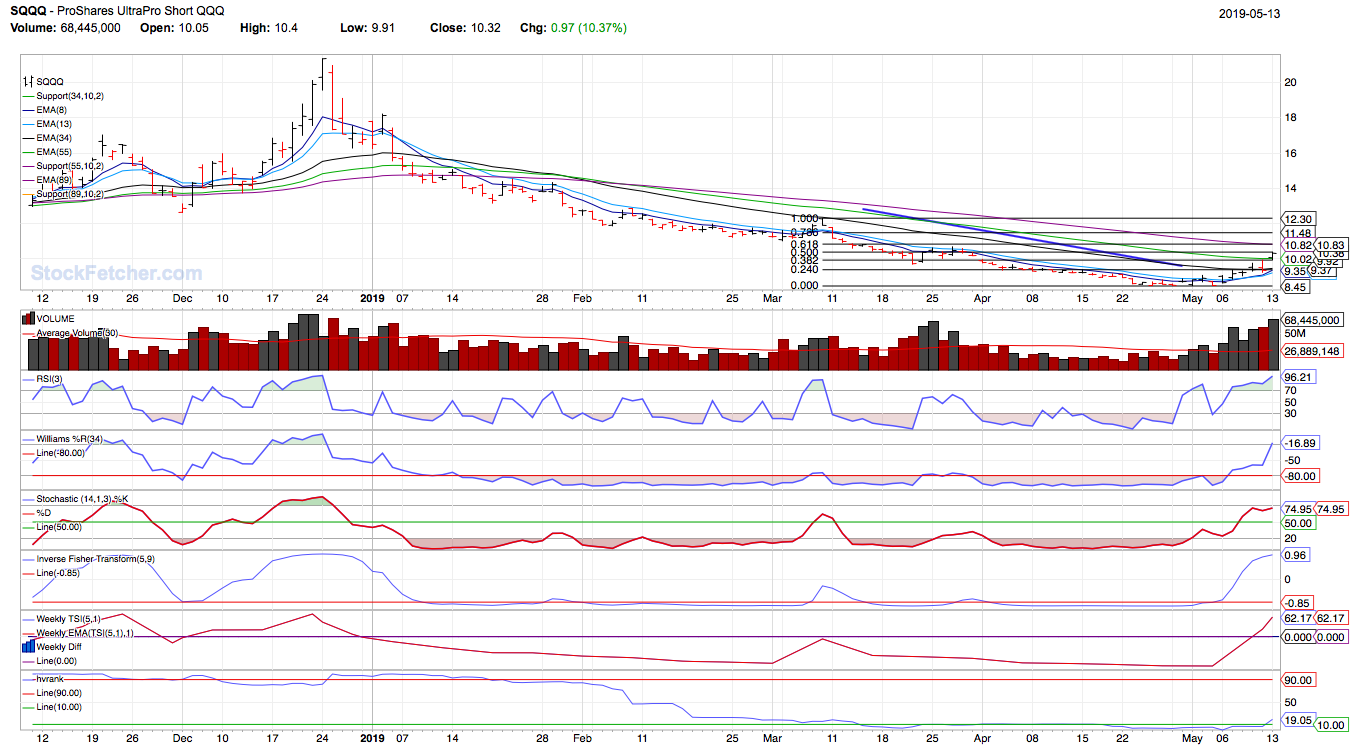 Now comes...when to get off the wagon question: how do i script this line: - average volume(30) * 50% = x (i think this is: set {V, average volume(30) * .50) - draw V on volume plot i don't know how to do the 2nd line. Thank you |
| xarlor 646 posts msg #147788 - Ignore xarlor |
5/14/2019 2:40:11 PM sandjco, this is the best I could do: |
| sandjco 648 posts msg #147789 - Ignore sandjco |
5/14/2019 5:13:32 PM Many thanks Xarlor! appreciate it! |
| four 5,087 posts msg #147793 - Ignore four modified |
5/14/2019 11:11:21 PM |
| sandjco 648 posts msg #147795 - Ignore sandjco |
5/15/2019 12:20:34 PM Thank you four! Interesting presentation... What I was trying to do was to: - draw a horizontal line on the volume pane that represented the "outliers" (spikes) over say 1 year and - draw another horizontal line on the volume pane that represented the other spectrum wherein the volume was really low vs what it usually trades at over say 1 year Will most likely close short positions and reverse course to go long SOXL and TECL. My gut said to close these yesterday and reverse course. PIcked up MRVL and GOOG yesterday but will use today's EOD 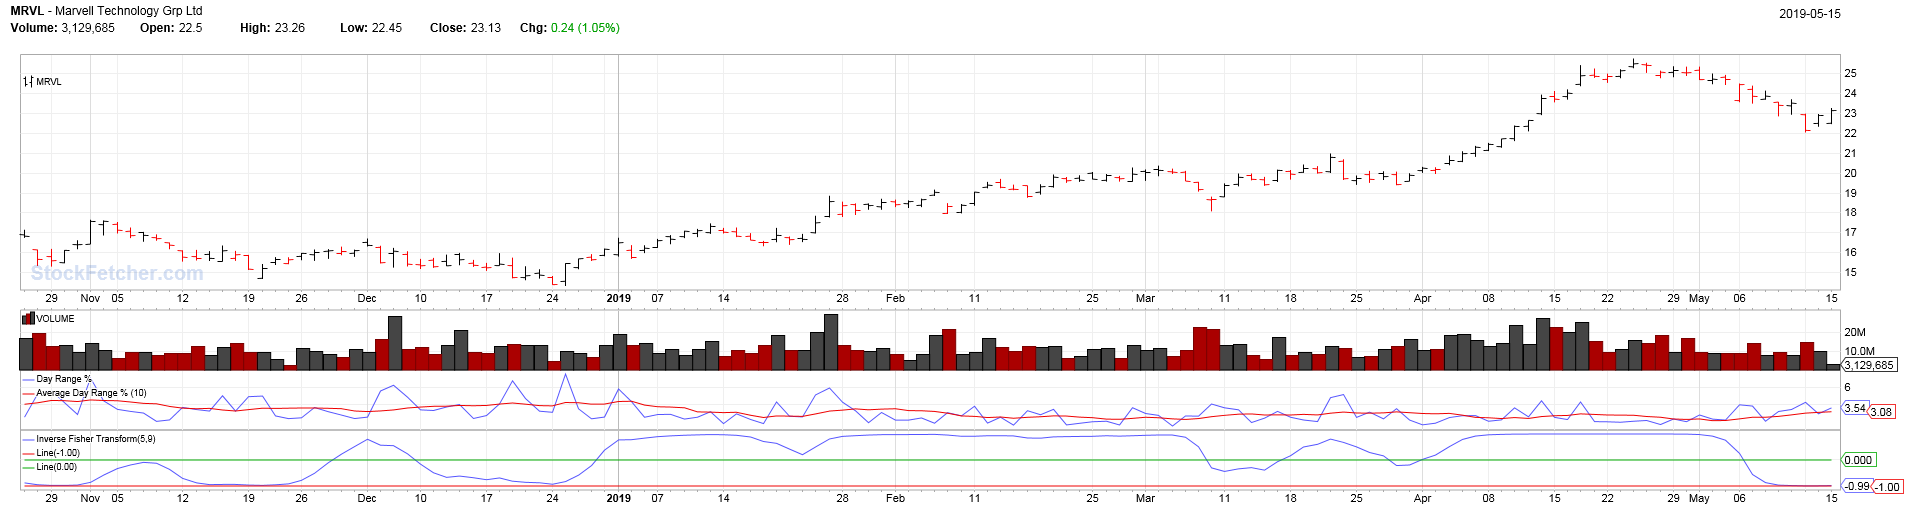 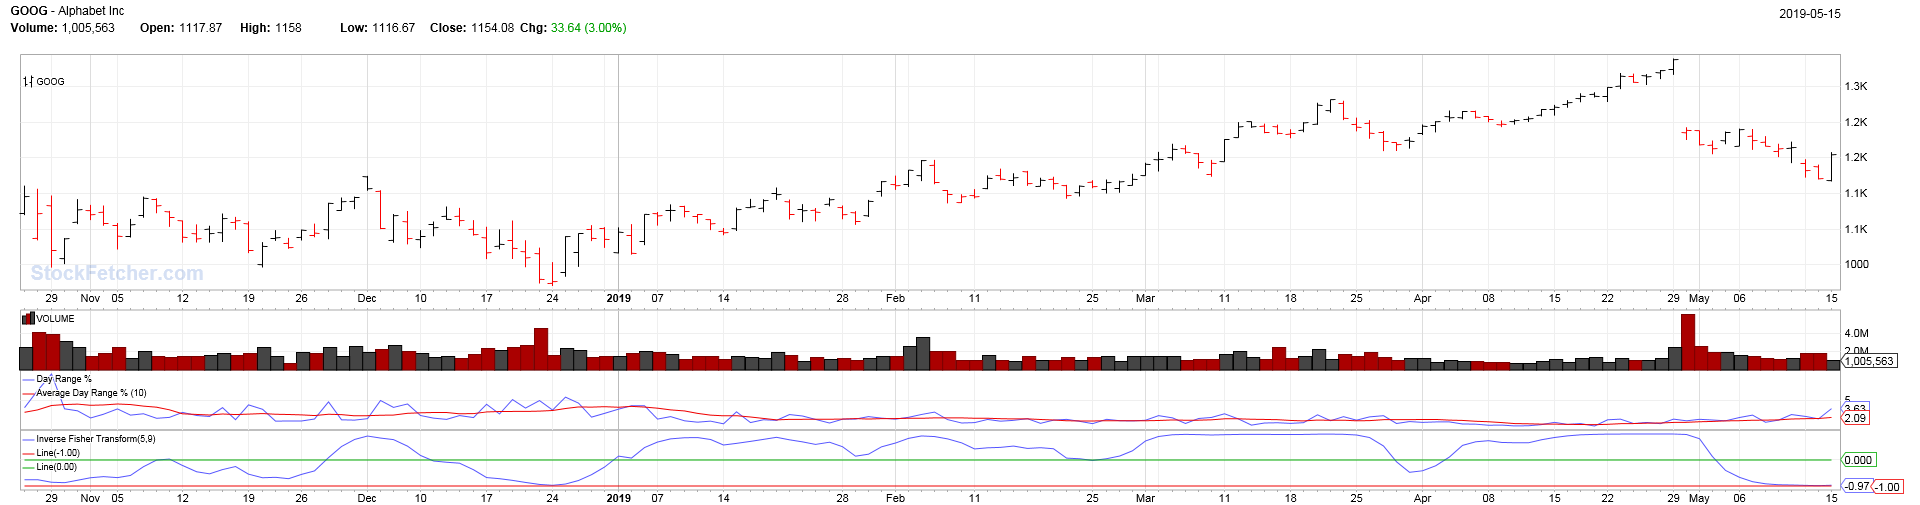  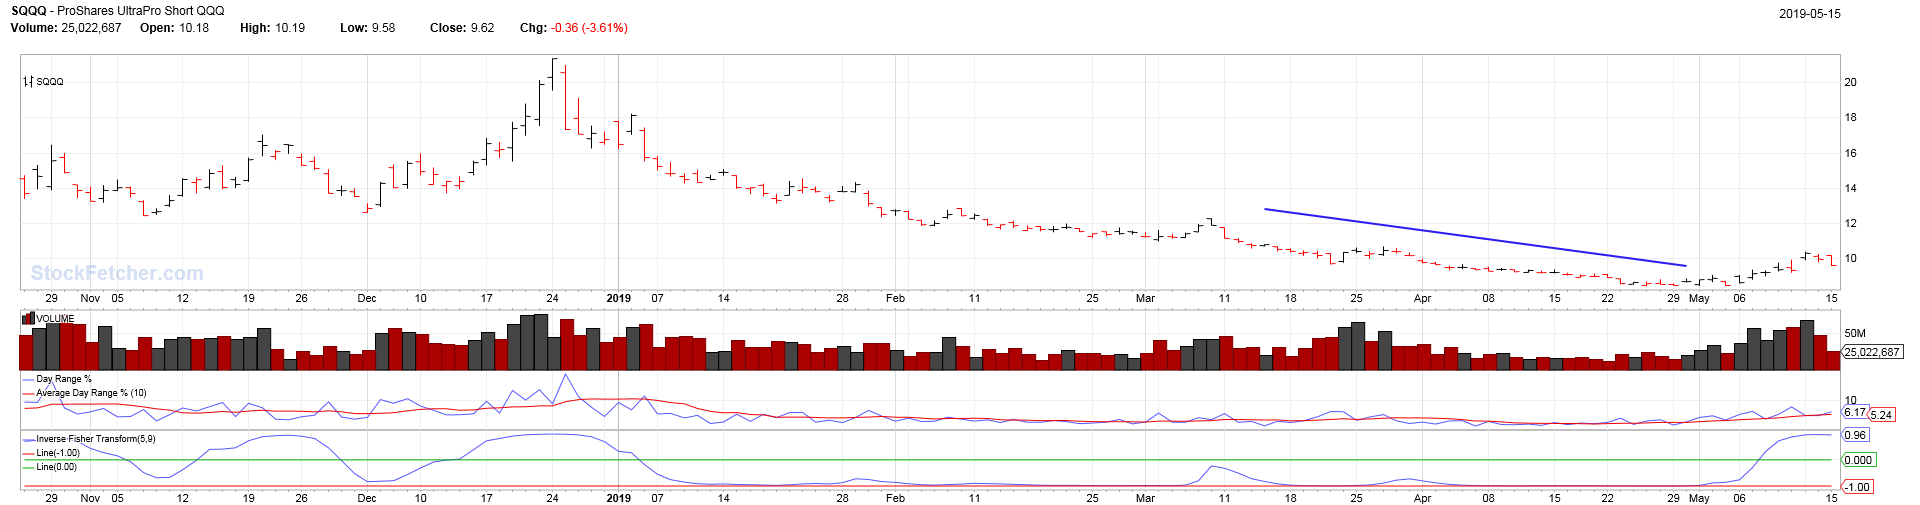 |
| four 5,087 posts msg #147812 - Ignore four |
5/17/2019 12:30:01 AM |
| sandjco 648 posts msg #147829 - Ignore sandjco |
5/18/2019 8:15:44 AM As always, thank you four! Thank you again xarlor for taking the first shot. How do I make the vol 1.5 and vol 2.5 be horizontal lines plotted on vv plot so I will now have 3 horizontal lines on the vv plot? Thank you in advance |
| Village Elder 231 posts msg #147830 - Ignore Village Elder |
5/18/2019 8:38:47 AM Why not use the custom Bollinger Bands? something like |
| StockFetcher Forums · Stock Picks and Trading · A Newbie's Journey | << 1 ... 38 39 40 41 42 ... 48 >>Post Follow-up |