| StockFetcher Forums · General Discussion · XIV | << 1 ... 5 6 7 8 9 ... 22 >>Post Follow-up |
| novacane32000 331 posts msg #141098 - Ignore novacane32000 |
1/17/2018 7:19:24 PM Hey Davesaint86 Maybe I’m not understanding how your 1st filter in this thread works. I did a backtest on DUST from 2/2/15 to present and it almost seems too good to be true . 47 wins 5 losses with the avr win being 50% and the avr loss around 4%. That cant be right !! Not sure what I did wrong as far as entering and exiting the trade. I simply bought and sold when the filter toggled from longposition to shortposition. What am I missing here ?? |
| shillllihs 6,102 posts msg #141099 - Ignore shillllihs modified |
1/17/2018 7:46:34 PM I think it is too good to be true. Yesterday was Xiv's first short day, now there are 3 short days. maybe I'm not understanding this completely. How are days changing days later and this would defiantly give some erroneous signals. Unless your signal comes from elsewhere. Sorry if you've answered this already. I was thinking I could retire to some exotic island, or own it with this system. |
| davesaint86 726 posts msg #141100 - Ignore davesaint86 |
1/17/2018 8:26:53 PM If the bars are changing I do not know how. I did not change the the filter. I made a copy of the filter this morning and renamed it and removed all of the moving averages off the plot to see if the DMA8 crossover matched the red vertical bars and it did. Do you think it is possible based on the volatility yesterday of XIV that a bar could have been fluttering off and on all day from being a buy to sell. Maybe it was on that fine line, I don't know. It seems like the best thing to do is create a PowerPoint file and copy and print the end of the day screen shot and if you see for example a vertical bar at the end of the day and then tomorrow that bar is gone then something else is going on. |
| davesaint86 726 posts msg #141103 - Ignore davesaint86 |
1/17/2018 9:05:47 PM I removed a lot of guts of filter to make it easier to troubleshoot. I used the backtest featured and went back three days to Jan 11th. The bar for this date is correct. The bar for Jan 12th is showing a Short bar. In my opinion this is not correct. The bars from yesterday and today are correct. I added the dma(8,-5),8) and cma(dma(8,-5),8) columns. If the dma(8,-5),8) is greater cma(dma(8,-5),8) it should still be a buy. Could it be that the E3>0,1 needs to be modify to less that one something like .0001 maybe? I'll play with tomorrow. If you look at the chart for XIV the lines are right on top of each other. |
| davesaint86 726 posts msg #141104 - Ignore davesaint86 |
1/17/2018 9:49:38 PM Mach - can you please take a look at the filter in the post above. In my opinion the January 12 vertical bar should be showing long not short. Do you have a fix to resolve this issue? Thanks! |
| sandjco 648 posts msg #141105 - Ignore sandjco |
1/17/2018 9:52:50 PM Hey Davesaint86... Is there a way for the filter to spit out the result say...yesterday it was a "sell" but today it turned into a "buy"? This way..only tickers with a buy signal shows up on the scan? Thanks |
| shillllihs 6,102 posts msg #141106 - Ignore shillllihs |
1/17/2018 9:55:48 PM I think but can't be sure, that I've seen as many as 2 bars off on another etf and I definitely have seen bars change intraday. I'd be interested if there was a fix for this. |
| novacane32000 331 posts msg #141107 - Ignore novacane32000 |
1/17/2018 10:01:58 PM Yes, I noticed the signals changing also. Dust signal had changed from shortposition to longposition when I ran it Sunday night . Ran it again during the day Tuesday and the signal had changed to short and continues short today. |
| davesaint86 726 posts msg #141108 - Ignore davesaint86 |
1/17/2018 10:13:51 PM I do not know if it is the Count function that is screwing the vertical bars up. |
| Mactheriverrat 3,178 posts msg #141109 - Ignore Mactheriverrat modified |
1/17/2018 11:05:55 PM XIV -Not sure why the column on 1-12-18 is acting up. Column says long and long position / short position say sell. 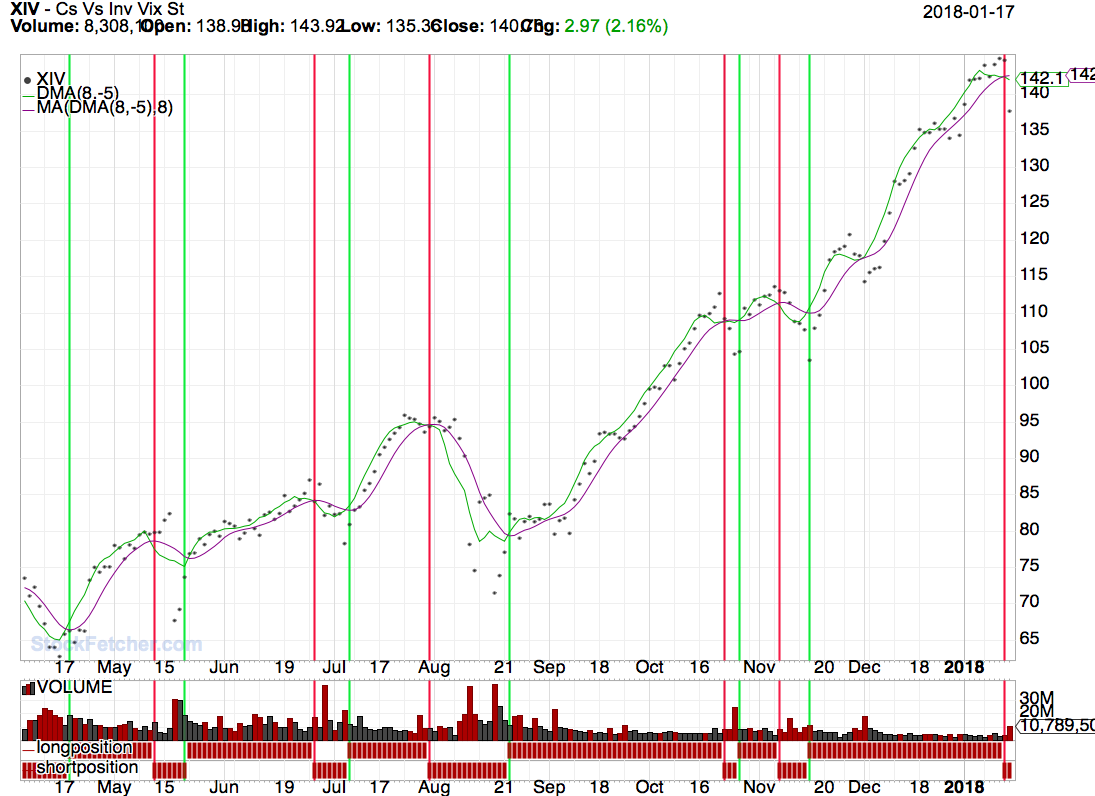 Might even be a SF data bug. |
| StockFetcher Forums · General Discussion · XIV | << 1 ... 5 6 7 8 9 ... 22 >>Post Follow-up |