| StockFetcher Forums · General Discussion · XIV | << 1 ... 11 12 13 14 15 ... 22 >>Post Follow-up |
| Mactheriverrat 3,178 posts msg #141506 - Ignore Mactheriverrat |
1/29/2018 6:14:49 PM Waiting for the first day buy on the cma(DMA(8,-5),8). 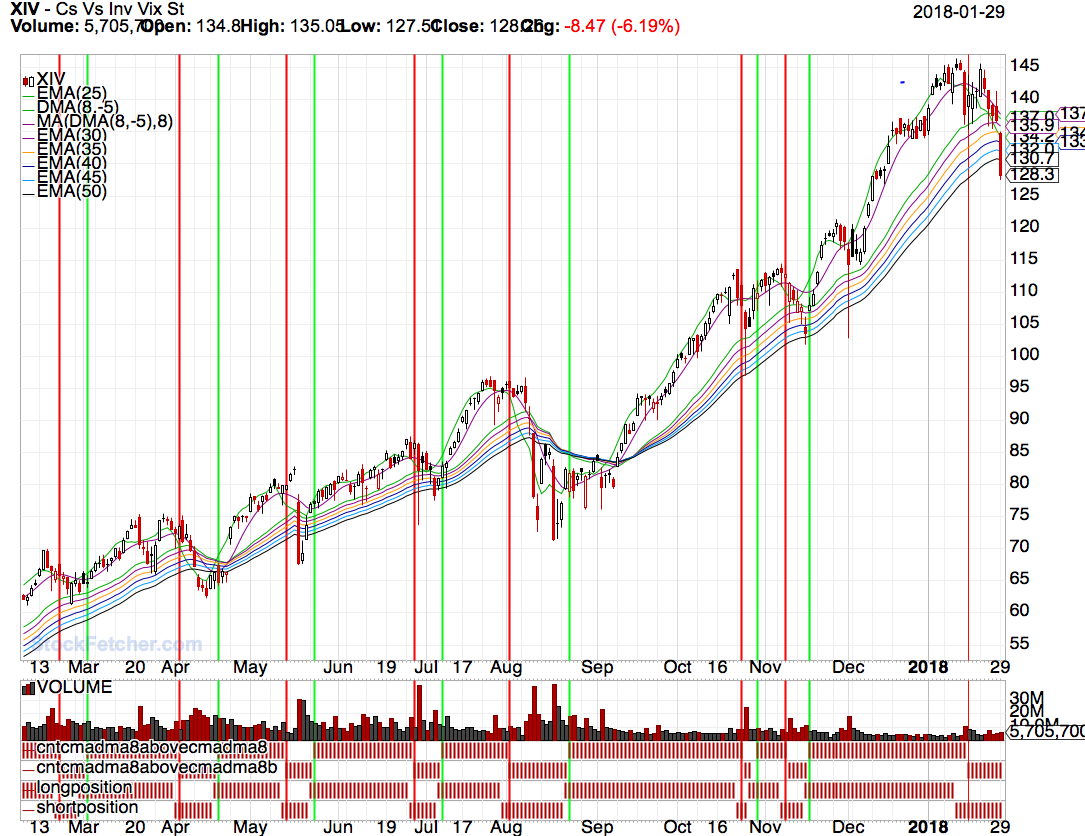 |
| Cheese 1,374 posts msg #141510 - Ignore Cheese modified |
1/29/2018 7:42:41 PM Thanks, Mac and Dave. |
| davesaint86 726 posts msg #141512 - Ignore davesaint86 modified |
1/29/2018 9:03:02 PM Weekly Version 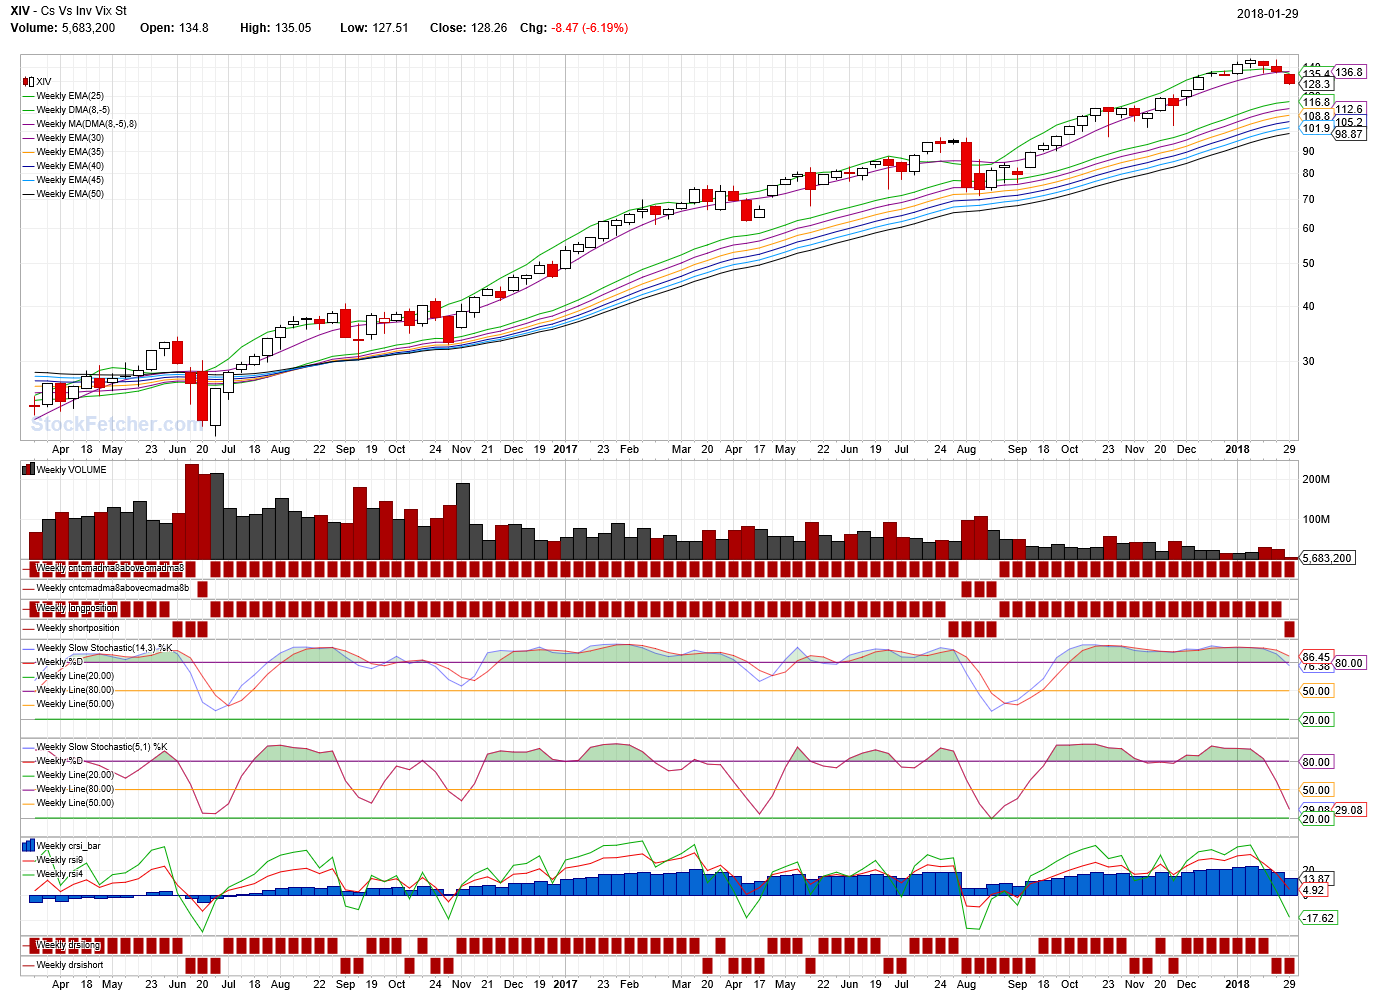 |
| Mactheriverrat 3,178 posts msg #141520 - Ignore Mactheriverrat |
1/30/2018 1:58:51 AM @Dave Great Chart. |
| karennma 8,057 posts msg #141523 - Ignore karennma |
1/30/2018 6:57:45 AM Indeed! Yes, Dave, that's a great chart. Just great! If it's not too much trouble, can U post the filter here. I'm not being lazy; I could write my own verson but I don't know how to write the code for the red boxes. I love how those little red boxes flip when the direction changes. Thanks again. |
| davesaint86 726 posts msg #141526 - Ignore davesaint86 modified |
1/30/2018 9:08:57 AM No problem! Sometimes it's good seeing the weekly without the daily noise in it. |
| karennma 8,057 posts msg #141534 - Ignore karennma modified |
1/30/2018 10:25:59 AM Thanks! Okay .... Figured out my first question ... Here's the 2nd. What part of the filter tells SF to draw those red squares (rectangles). :>) |
| davesaint86 726 posts msg #141535 - Ignore davesaint86 |
1/30/2018 10:31:03 AM Karen - I do not have the Bollinger Bands showing. What it is a potential price target objective sell point based on Ira Epstein's trading rules. He states that professional tradings take profits at the upper Bollinger band. So if you see a 1 (VXX for example) you may want to take some or all of the money off the table. He states that if price is above the upper Bollinger band within five days it will cross back under. |
| davesaint86 726 posts msg #141536 - Ignore davesaint86 |
1/30/2018 10:32:16 AM The difference between CDMA8 and DMA8. |
| davesaint86 726 posts msg #141554 - Ignore davesaint86 |
1/30/2018 2:53:48 PM I drew this before the market opened this morning. The low touched the first line (119 or so). Next line $113. 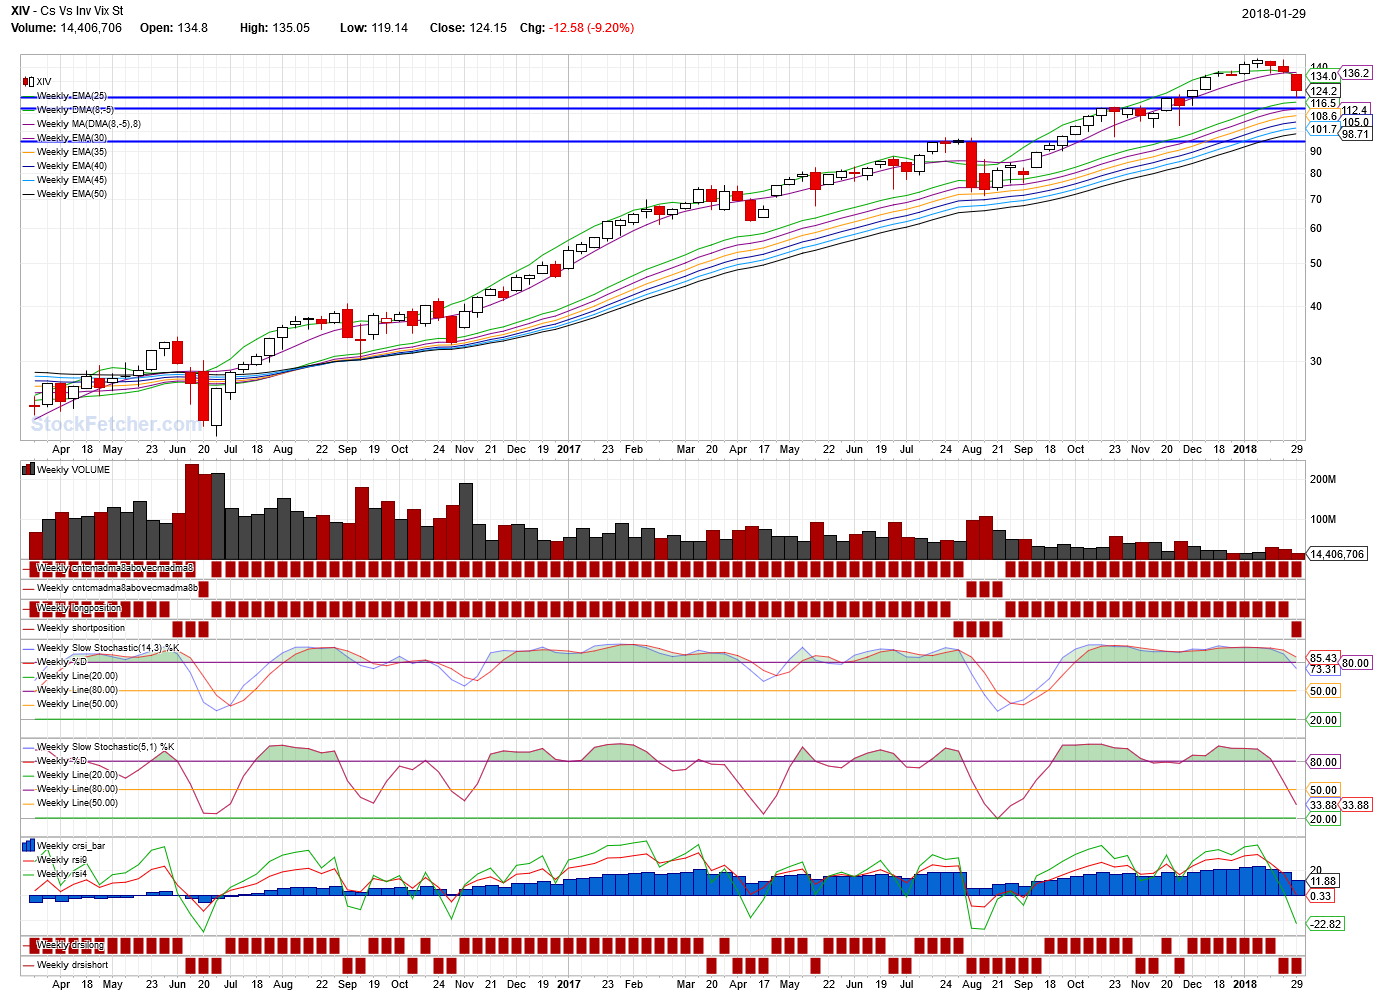 |
| StockFetcher Forums · General Discussion · XIV | << 1 ... 11 12 13 14 15 ... 22 >>Post Follow-up |