| StockFetcher Forums · Filter Exchange · RSI 2 Bounce Filter | << 1 2 3 >>Post Follow-up |
| bert123 56 posts msg #159999 - Ignore bert123 |
1/18/2023 1:30:12 PM Asking if a Stockfetcher Expert could create a filter utilizing RSI 2 with a Count function. Background: I look at stocks where the RSI 2 has closed below 10 in the last day. Sometimes I will buy them at the close and then sell on the bounce normally in the next few days. I have found that those stocks which have a history of RSI 2 going below 10 and only staying below 10 for a few days in the past have a higher likelihood of bouncing back compared to those who have a history of staying below 10 for several days when they crossed below 10 in the past. This is logical and points to stronger stocks generally, but not always. The filter I am asking for would give the following results: 1. RSI(2) crossed below 10 in last one day. 2. Number of times it has crossed below 10 in the last 100 days. 3. Number of days RSI(2) stayed below 30 after crossing below 10 This could be stated statistically in columns by days; 1,2,3,4,5,6,7, etc. If, for example, I run the filter and see that RSI(2) crossed below 10 for stock ABC and that this has happened 10 times in the last 100 days. I also see that in 8 of those 10 occurrences, RSI(2) crossed back above 30 within 3 days or less. This is a stock that I would seriously look at for a bounce, but of course, compared with additional criteria. Thank you in advance to any and all who are willing to take a stab at this. |
| xarlor 646 posts msg #160000 - Ignore xarlor |
1/18/2023 5:34:20 PM This is more visual than an actual count. Three rows with ticks. Row 1: RSI(2) crossed below 10. This is your trigger point. Row 2: RSI(2) is between 10 and 30. Row 3: RSI(2) crossed above 30. You'll want to visually scan row 2 at periods between rows 1 and 3. As you said, these periods are often around 3 days. I did include in the columns how many times RSI(2) spent below 10 in the last 100 days. |
| nibor100 1,103 posts msg #160002 - Ignore nibor100 |
1/19/2023 11:24:33 AM @bert123, When you state you want to know how many days the RSI(2) stays below 30 after it goes below 10, do you count the day that it goes below 10 as one day? How do you treat multiple days where it stays below 10 before crossing above 30? Thanks, Ed S. |
| bert123 56 posts msg #160003 - Ignore bert123 |
1/19/2023 11:37:34 AM Xarlor, Thank you very much for creating this Filter. I really appreciate it! |
| bert123 56 posts msg #160004 - Ignore bert123 |
1/19/2023 3:32:28 PM Thanks for your interest in this Ed S. You wrote: When you state you want to know how many days the RSI(2) stays below 30 after it goes below 10, do you count the day that it goes below 10 as one day? How do you treat multiple days where it stays below 10 before crossing above 30? Thanks, Ed S. Great questions and to answer them I'll explain the objective of the proposed filter first. I'd like to target stocks that bounce quickly after RSI(2) crosses below 10. If, for example, stock ABC has crossed below 10 times in the last 100 days and 8 out of those 10 times bounced after the first day, 1 time after 2 days and 1 time after 3 days then columns of the filter would show 1 day, 2 days, 3 days, etc. It would also have columns that show that this stock bounced 80% of the time after 1 day, 90% of the time after 2 days and 100% of the time after 3 days. Pending other criteria for the trade, I would buy this stock on the close on the day RSI(2) crosses below 10 and sell when it hits the target of price above ema(5) or stop loss. To answer your questions: 1. Yes, day one is the first day - filter is run about 15 minutes before the close and the buy is as near as you can get to the close. MOC orders are good to get the close for Nasdaq stocks but bad slippage for NYSE and other. If using this concept, I use NASDAQ MOC only or do limit orders while managing it. 2. Multiple days below 10 are just added to the count. I think the biggest challenge is trying to figure out what constitutes the bounce in a Filter format. If, for example, the filter could show that after RSI(2) crossed below 10, stock ABC closed above ema(5) within 5 days X% of the time, or it could be that RSI(2) crossed above 50 within 2 days, 3 days, etc. 80% of the time. Going back to stock ABC, it would be ideal to know that when RSI (2) crossed below 10, RSI(2) crossed back above 50 within 2 days 80% of the time over the last 100 days, as an example. This may be too much to ask for, but if it could be done in a columnar format it would be greatly appreciated. Thanks in advance to anyone willing to give this a try. |
| bert123 56 posts msg #160005 - Ignore bert123 |
1/19/2023 3:45:56 PM I wanted to share the filter below to illustrate the statistical approach to this person's filter design. I wish I knew who created this filter so I could credit them. The filter itself has nothing to do with the RSI(2) Bounce Filter - I wanted to share it for illustrative purposes on the layout. Nonetheless, maybe some of you would like to experiment with it. set{hiop,high - open} set{hioppct,hiop / open} set{trigger,0.02} /*Trigger - Stock Up 2% from open*/ set{trigger1,1 + trigger} set{triggervalue,trigger1 * open} set{gain0.25%,trigger + 0.0025} set{gain0.5%,trigger + 0.005} set{gain1.0%,trigger + 0.01} set{gain1.5%,trigger + 0.015} set{gain2.0%,trigger + 0.02} set{gain2.5%,trigger + 0.025} set{gain3.0%,trigger + 0.03} set{uptrigger,count(hioppct > trigger,100)}/*Count how many times stock achieves 2% above open*/ set{upgain0.25%,count(hioppct > gain0.25%,100)}/*Count how many times stock achieves 0.25% above trigger*/ set{upgain0.5%,count(hioppct > gain0.5%,100)}/*Count how many times stock achieves 0.5% above trigger*/ set{upgain1.0%,count(hioppct > gain1.0%,100)}/*Count how many times stock achieves 1.0% above trigger*/ set{upgain1.5%,count(hioppct > gain1.5%,100)}/*Count how many times stock achieves 1.5% above trigger*/ set{upgain2.0%,count(hioppct > gain2.0%,100)}/*Count how many times stock achieves 2.0% above trigger*/ set{upgain2.5%,count(hioppct > gain2.5%,100)}/*Count how many times stock achieves 2.5% above trigger*/ set{upgain3.0%,count(hioppct > gain3.0%,100)}/*Count how many times stock achieves 3.0% above trigger*/ set{up0.25,upgain0.25%} set{up0.5,upgain0.5%} set{up1.0,upgain1.0%} set{up1.5,upgain1.5%} set{up2.0,upgain2.0%} set{up2.5,upgain2.5%} set{up3.0,upgain3.0%} set{1percentW, upgain1.0% / uptrigger} set{1percentT, triggervalue * 1.01} add column average volume(90) add column open add column uptrigger{trigger2%} add column triggervalue add column 1percentT add column High add column 1percentW add column average day range(100) add column up0.25{up0.25%} add column up0.5{up0.5%} add column up1.0{up1%} add column up1.5{up1.5%} add column up2.0{up2%} add column up2.5{up2.5%} add column up3.0{up3.0%} sort column 11 descending up1.0 above 9 average volume(30) above 100,000 close above 20 1percentW above .69 market is etf |
| snappyfrog 753 posts msg #160012 - Ignore snappyfrog |
1/20/2023 10:00:38 AM Making it clickable ... |
| nibor100 1,103 posts msg #160022 - Ignore nibor100 |
1/22/2023 1:43:42 AM @bert123, The filter below adds one more line of display to Xarlor's filter, showing all of the days Rsi(2) is below 30. Comparing that row with the row of days below 10 for the symbol BOIL seems to present several issues that I'm not sure how you would want a filter to address in a column display. 1. For example, BOIL has 10 instances of RSI(2) going below 10 in last 100 days, a. 3 of the 10 occur before RSI(2) bounces back above 30 after the initial cross below 10 b. Are new count sequences supposed to start with each time it goes below 10? c. Does the count for how many days until the bounce above 30 continue for the first instance even though it has crossed below 10 one or more additional times before crossing back above 30? 2. Does it matter if RSI(2) has already been below 30 when it crosses below(10)? 3. When I look at BOIL I conclude there is either only 1 ideal situation, that you are searching fo,r or there are 3 ideal situations, depending on your answers to the above questions. Thanks, Ed S. |
| bert123 56 posts msg #160030 - Ignore bert123 |
1/22/2023 4:57:57 PM Thanks Ed S. and thanks again Xarlor for getting the ball rolling. At this point I think it would be best to give an example of what I am looking for and then explain how I would like for us to see it in a filter. Please run the filter and go back to January 11, 2023 Bring up the chart of ACLX. Change the chart to a 6-month view. As you know, I buy on the close of the first day the RSI(2) crosses below 10. A Macro filter can be used to /__REMOVED__/those stocks that show an uptrend. I only /__REMOVED__/NASDAQ stocks because I can submit a MOC order through my broker and get the actual closing price most of the time. Doing the same thing with NYSE or other has resulted in getting poor fills. I hold until I get a close above MA(5) or get stopped out. Sometimes the close above MA(5) will still result in a loss - that's trading. Also, I avoid those stocks that are reporting earnings in the next 7 days. Next, I will show the results of trading ACLX and then offer up what I hope is a simplified solution for the filter display. Note: Holding days count trading days only: 8/19/22 entry 17.79. 8/24 exit 18.42. Under MA(5) 3 days. Profit 3.5% 8/26/22 entry 16.74. 8/31 exit 17.97 Under MA(5) 3 days. Profit 7.3% 9/22/22 entry 17.71. 9/27 exit 18.90. Under MA(5) 3 days. Profit 6.7% 10/7/22 entry 17.18. 10/10 exit 18.90. Under MA(5) 1 day. Profit 10% 11/16/22 entry 20.18. 11/18 exit 21.28. Under MA(5) 2 days. Profit 5.5% 1/11/23 entry 29.15. 1/13 exit 32.16. Under MA(5) 2 days. Profit 10.3% This is a stock that I am looking for (pending other criteria) and I will now list a columnar format that I think simplifies the filter but still gives the necessary information plus whatever you could also add like Average Profit, Winners, Losers, etc. that would be helpful. The filter I attached earlier gives some layout examples. Number of Times RSI(2) crossed below 10 in last 100 days. Close below MA(5) One Day before closing above MA(5) Close below MA(5) Two Days before closing above MA(5) Close below MA(5) Three Days before closing above MA(5) Close below MA(5) Four Days before closing above MA(5). Close below MA(5) Five Days or more before closing above MA(5). As in the example above, I'm looking for those stocks that historically have bounced quickly once the RSI(2) crossed below 10. Out of the 6 times that ACLX qualified, it closed above the MA(5) 100% of the time after being under MA(5) for a maximum of 3 days and was profitable 100% of the time. These stocks can also be found by observation, but this can be quite time consuming. A filter that instantly displays the information would be greatly appreciated and hopefully worthwhile to the Stockfetcher community. Thanks again for your contributions. |
| Mactheriverrat 3,178 posts msg #160031 - Ignore Mactheriverrat |
1/22/2023 6:36:18 PM RSI(2) can get you a bounce off the bottom , buy into a uptrend and a buy into a existing uptrend. 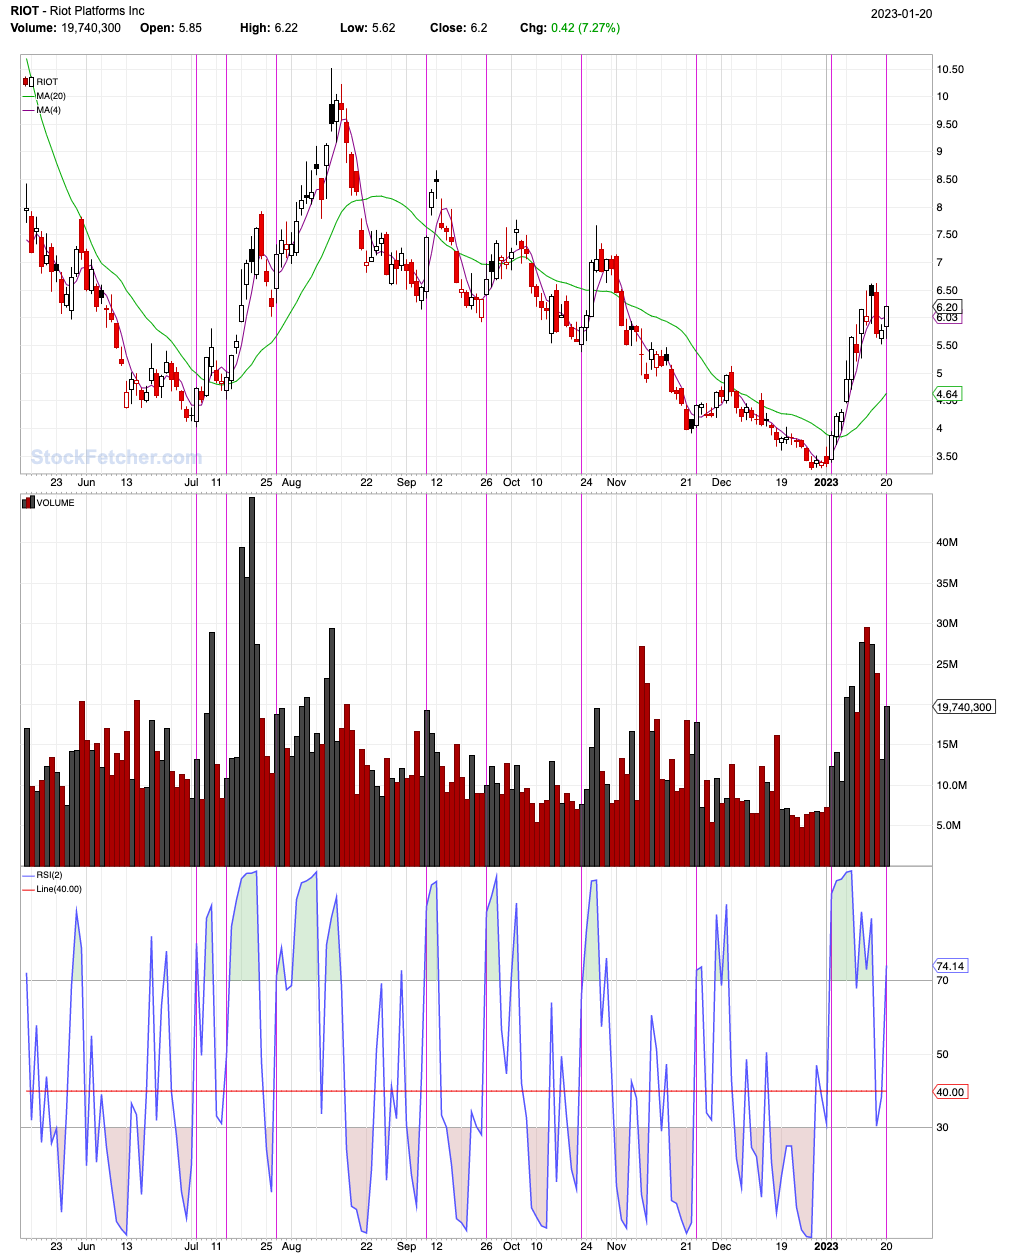 Submit |
| StockFetcher Forums · Filter Exchange · RSI 2 Bounce Filter | << 1 2 3 >>Post Follow-up |