StockFetcher Forums · Filter Exchange · Almost got my TMF filter working but need one more thing fixed. Help please.<< 1 2 >>Post Follow-up
pa247
143 posts
msg #148043
Ignore pa247
modified
6/4/2019 4:13:31 PM

So this is the Twiggs Money Flow filter that Ive been working on as my first project to try and learn SF. I think Ive almost got it except for the last 2 bits I need. here is the code and a chart that explains where its not working the way I think it should. Any help is appreciated!

Fetcher[ /* Twiggs Money Flow indicator was developed by Colin Twiggs for incrediblecharts to improve Chaikin Money Flow (CMF). The main idea behind the TMF indicator is to evaluate volume (money flow) as bullish or as bearish based on a close price location. Chaikin Money Flow uses CLV (Close Location Value) to do it. Twigs Money Flow, on the other hand, uses TR (True Range). Another main difference is that CMF uses cumulative volume (sum of volumes over specified period) and the TMF applies Moving average to the volume. */

not etf
not otcbb
close > 1
optionable


/* Calculate Highest High (HH) and Lowest Low (LL)
LL = minimum(current low or previous close)
HH = maximum(current High or previous close) */
set{LL, min(low, close)}
set{HH, max(high, close)}

/* calculate Range = (Close - LL) / (HH - LL) * 2 - 1 ) */
set{R1, Close - LL}
set{R2, HH - LL}
set{R3, R1 / R2}
set{R4, R3 * 2}
set{R5, R4 - 1} /* R5 = Range */

/* Calculate Range Volume
RangeV = EMA (Volume * Range) */
set{range1, volume * R5}
set{rangeV, CEMA(range1,21)}

/* Calculate TMF = RangeV / EMA(Volume) * 100 */
set{tmf1, cEMA(volume,21)}
set{tmf2, tmf1 * 100}
set{tmf, rangeV / tmf2}
add column tmf

/* so this next line is where Im trying to limit the number of stocks and isnt working right */
tmf crossed above 0.001

draw CEMA(tmf,21) line at 0
draw ema(13)

/* (Apply EMA to TMF as second signal line) TMF Signal Line = EMA(TMF) */
set{tmfsignal, CEMA(tmf,21)}

/* and this next line is a further limit that isnt working right either */
tmfsignal crossed above 0.001 2 days ago
]


If you look at this chart you can see where its not correct.
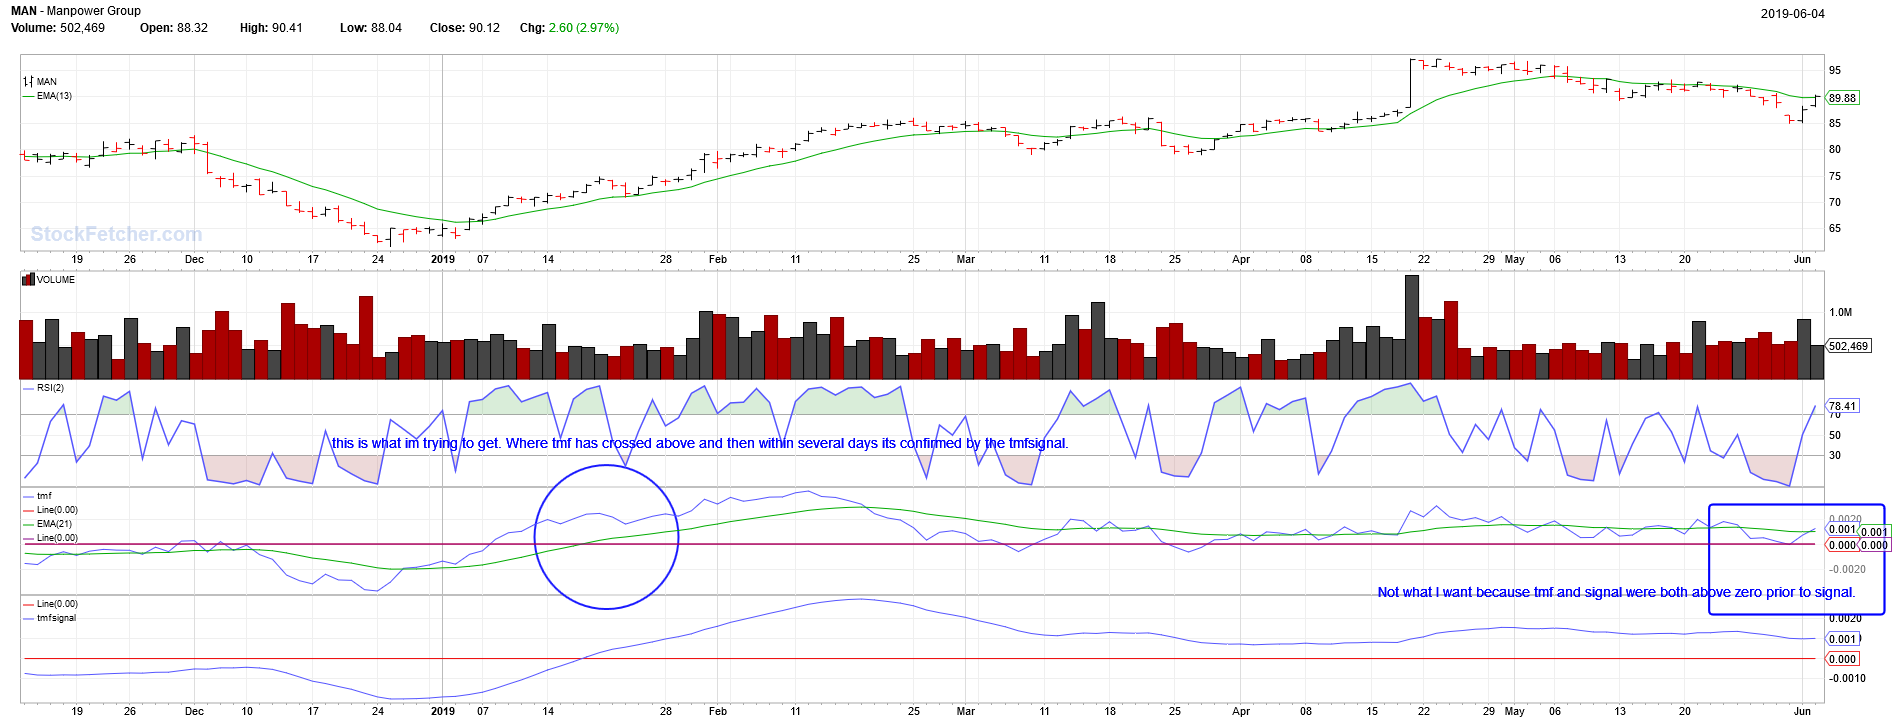

mahkoh
1,065 posts
msg #148053
Ignore mahkoh
6/5/2019 3:03:03 PM

I think you should use:

/* Calculate Highest High (HH) and Lowest Low (LL)
LL = minimum(current low or previous close)
HH = maximum(current High or previous close) */
set{LL, min(low, close 1 day ago)}
set{HH, max(high, close 1 day ago)}

You don't want to use R1 as variable name, that is already hardcoded to pivot r1:

/* calculate Range = (Close - LL) / (HH - LL) * 2 - 1 ) */
set{RB1, Close - LL}
set{RB2, HH - LL}
set{RB3, RB1 / RB2}
set{RB4, RB3 * 2}
set{RB5, RB4 - 1} /* R5 = Range */

/* Calculate Range Volume
RangeV = EMA (Volume * Range) */
set{range1, volume * RB5}
set{rangeV, CEMA(range1,21)}

So this is what I get, I have to leave out the last line to not run in economy class restrictions
Fetcher[
/* Twiggs Money Flow indicator was developed by Colin Twiggs for incrediblecharts to improve Chaikin Money Flow (CMF). The main idea behind the TMF indicator is to evaluate volume (money flow) as bullish or as bearish based on a close price location. Chaikin Money Flow uses CLV (Close Location Value) to do it. Twigs Money Flow, on the other hand, uses TR (True Range). Another main difference is that CMF uses cumulative volume (sum of volumes over specified period) and the TMF applies Moving average to the volume. */

not etf
not otcbb
close > 1
optionable


/* Calculate Highest High (HH) and Lowest Low (LL)
LL = minimum(current low or previous close)
HH = maximum(current High or previous close) */
set{LL, min(low, close 1 day ago)}
set{HH, max(high, close 1 day ago)}

/* calculate Range = (Close - LL) / (HH - LL) * 2 - 1 ) */
set{RB1, Close - LL}
set{RB2, HH - LL}
set{RB3, RB1 / RB2}
set{RB4, RB3 * 2}
set{RB5, RB4 - 1} /* R5 = Range */

/* Calculate Range Volume
RangeV = EMA (Volume * Range) */
set{range1, volume * RB5}
set{rangeV, CEMA(range1,21)}

/* Calculate TMF = RangeV / EMA(Volume) * 100 */
set{tmf1, cEMA(volume,21)}
set{tmf2, tmf1 * 100}
set{tmf, rangeV / tmf2}
add column tmf

/* so this next line is where Im trying to limit the number of stocks and isnt working right */
tmf crossed above 0.001

draw CEMA(tmf,21) line at 0
draw ema(13)

/* (Apply EMA to TMF as second signal line) TMF Signal Line = EMA(TMF) */
set{tmfsignal, CEMA(tmf,21)}

/* and this next line is a further limit that isnt working right either */

]


Mactheriverrat
3,135 posts
msg #148054
Ignore Mactheriverrat
modified
6/5/2019 3:44:03 PM

Have you ever looked from a weekly chart standpoint and just the ema13


chart-display is weekly


graftonian
1,089 posts
msg #148056
Ignore graftonian
modified
6/5/2019 4:26:00 PM

After a qick "once over", I only see one problem, that being the use of variable name "R1"
Affter replacing the R variables with xR, I believe your filter is behaving nicely
Try:
TMF crossed above tmfsignal
TMF > .001
sort on column 5 descending

ron22
255 posts
msg #148059
Ignore ron22
6/5/2019 5:11:44 PM

Mac, Weekly ema(13) looks interesting. What do you suggest for an exit trigger?

pa247
143 posts
msg #148063
Ignore pa247
6/6/2019 12:55:02 PM

@mahkoh - thank you for the R1 being the pivot symbol. Didnt realize that.

@mac - I havent tried the wwekly ema(13) but will definitely look at it.

@graftonian - thank you help with the R1 also. I tried how you suggested but it still isnt coming out right.

what Im trying to do is get a signal when tmf first crosses the zero line from below .....And.... then get a confirmation signal from tmfsignal when it also crosses the zero line from below, usually a few days later.

Ive also tried
tmf crossed above 0.001 3 days ago

........ and .....
tmf crossed above 0.001 from below 3 days ago


set{tmfsignal, CEMA(tmf,21)}
tmfsignal crossed above 0.0001 2 days ago

....... and ........

TMFsignal crossed above tmf 1 day ago
sort on column 5 descending


Mactheriverrat
3,135 posts
msg #148066
Ignore Mactheriverrat
6/6/2019 2:06:31 PM

@ron failure of the ema13 would be a good exit.

"Stan Weinstein's Secrets For Profiting in Bull and Bear Markets" suggests using the MA(30) or the wma30 on weekly charts. Just started reading his book in chapter 3 so far. I've been messing around with weekly charts for a couple of months and came across his book.

https://www.amazon.com/Stan-Weinsteins-Secrets-Profiting-Markets/dp/1556236832/ref=cm_cr_arp_d_product_top?ie=UTF8

Here is a video on weekly charts using the ma(30).


ron22
255 posts
msg #148069
Ignore ron22
6/6/2019 8:16:08 PM

Mac, Thank you for the exit signal and the ma(30) video. Also, thanks for all your informative posts and filters. I am always trying to learn to be a better trader.

Mactheriverrat
3,135 posts
msg #148070
Ignore Mactheriverrat
6/6/2019 8:52:04 PM

Your Welcome-
I'm always looking at other system setups too!

bushynose
22 posts
msg #148073
Ignore bushynose
modified
6/7/2019 12:03:42 AM

pa247

maybe you should use within the last X days?

Fetcher[

/* Twiggs Money Flow indicator was developed by Colin Twiggs for incrediblecharts to improve Chaikin Money Flow (CMF). The main idea behind the TMF indicator is to evaluate volume (money flow) as bullish or as bearish based on a close price location. Chaikin Money Flow uses CLV (Close Location Value) to do it. Twigs Money Flow, on the other hand, uses TR (True Range). Another main difference is that CMF uses cumulative volume (sum of volumes over specified period) and the TMF applies Moving average to the volume. */

not etf
not otcbb
close > 1
optionable


/* Calculate Highest High (HH) and Lowest Low (LL)
LL = minimum(current low or previous close)
HH = maximum(current High or previous close) */
set{LL, min(low, close)}
set{HH, max(high, close)}

/* calculate Range = (Close - LL) / (HH - LL) * 2 - 1 ) */
set{xR, Close - LL}
set{R2, HH - LL}
set{R3, xR / R2}
set{R4, R3 * 2}
set{R5, R4 - 1} /* R5 = Range */

/* Calculate Range Volume
RangeV = EMA (Volume * Range) */
set{range1, volume * R5}
set{rangeV, CEMA(range1,21)}

/* Calculate TMF = RangeV / EMA(Volume) * 100 */
set{tmf1, cEMA(volume,21)}
set{tmf2, tmf1 * 100}
set{tmf, rangeV / tmf2}
set{var1, tmf * 1000}
add column var1

/* so this next line is where Im trying to limit the number of stocks and isnt working right */
var1 crossed above 1
draw var1 line at 1

/* (Apply EMA to TMF as second signal line) TMF Signal Line = EMA(TMF) */
set{tmfsignal, CEMA(var1,21)}
set{var2, tmfsignal * 1000}
/* and this next line is a further limit that isnt working right either */
var2 crossed above 1 within the 3 weeks
draw var2 line at 1

draw CEMA(var1,21)} on plot var1

set{var5, count(CEMA(var1,21) crossed above 1, 1)}
draw var5
set{var6, count(var2 crossed above 1, 1)}
draw var6
]


StockFetcher Forums · Filter Exchange · Almost got my TMF filter working but need one more thing fixed. Help please.<< 1 2 >>Post Follow-up

*** Disclaimer *** StockFetcher.com does not endorse or suggest any of the securities which are returned in any of the searches or filters. They are provided purely for informational and research purposes. StockFetcher.com does not recommend particular securities. StockFetcher.com, Vestyl Software, L.L.C. and involved content providers shall not be liable for any errors or delays in the content, or for any actions taken based on the content.


Copyright 2022 - Vestyl Software L.L.C.Terms of Service | License | Questions or comments? Contact Us
EOD Data sources: DDFPlus & CSI Data Quotes delayed during active market hours. Delay times are at least 15 mins for NASDAQ, 20 mins for NYSE and Amex. Delayed intraday data provided by DDFPlus


This site is protected by reCAPTCHA and the Google Privacy Policy and Terms of Service apply.