StockFetcher Forums · Stock Picks and Trading · GameStop Do you have a filter that found it? When?<< 1 2 3 4 >>Post Follow-up
miketranz
956 posts
msg #155552
Ignore miketranz
2/2/2021 5:06:04 PM

Fetcher[Show stocks where price is between .15 and 40 and average volume (90) is above 2000000 and price has reached a new 90 day high and dram ma (9) and draw ma (18) and draw ma (27) ]

Ed,here's a very simple filter I use for catching big movers early.Best,Miketranz...

Nobody
404 posts
msg #155554
Ignore Nobody
modified
2/2/2021 9:36:13 PM

Sir miketranz

On the above filter you posted - I look at $OCGN and few others ... age old question how to catch those flat liners bit earlier ?


Totally separate ticker flat Lining $AIV or $OVID
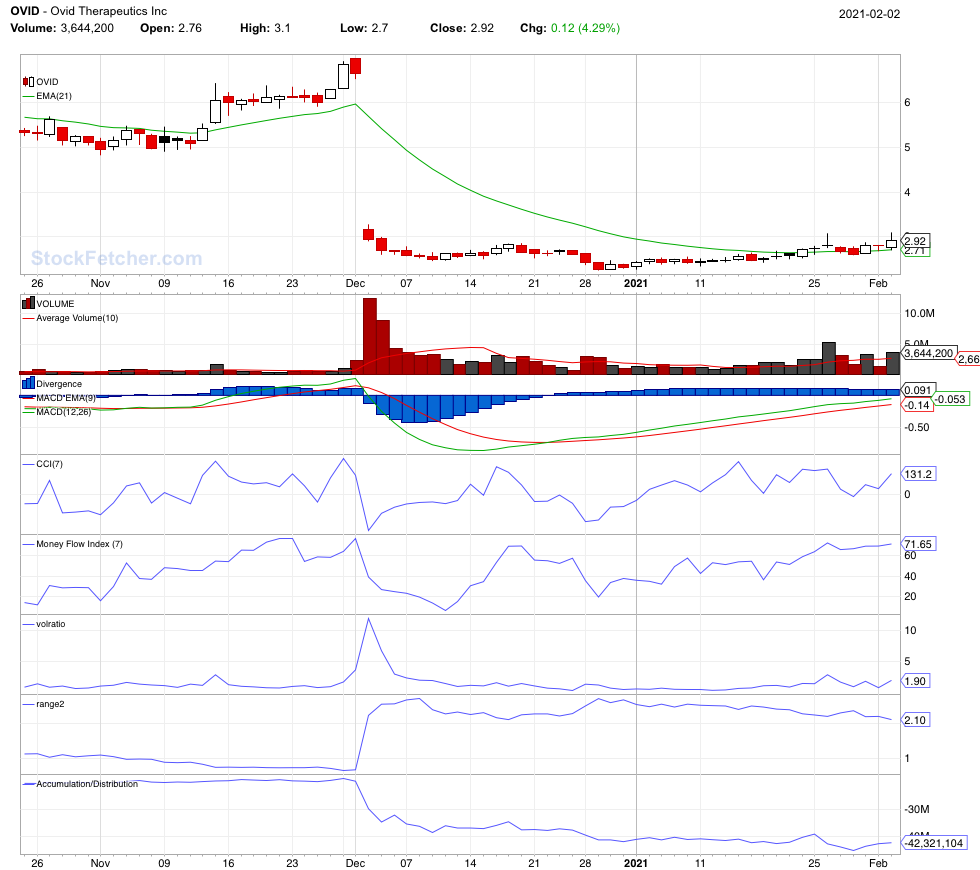

Thank you


Cheese
1,374 posts
msg #155555
Ignore Cheese
2/2/2021 10:52:01 PM


Ed,

This filter by graftonian told us what to do with GME along the way.
Are you looking for something more than this?
Looking forward to the results of your analysis.
Thanks.

For advanced subs:
Fetcher[
/*
https://www.stockfetcher.com/forums/Filter-Exchange/PPO-vs-Schaff-Trend-Cycle/155326
graftonian 1/15/2021 4:02:33 PM
*/

SYMLIST(GME)
chart-time 12 months

/**** PPO vs Schaff TC vs MACD *****/
optionable
chart time is 1 year
/********* daily PPO ********/
draw ppo(10,24)
set{DailyPPOsignal, cema(ppo(10,24), 8)}
draw DailyPPOsignal on plot ppo(10, 24)
/*********MACD**************/
draw MACD Slow Line(10,24,9)
/*schaff trend cycle*/
set{range, MACD (23,50,9) 10 day high - MACD (23,50,9) 10 day low}
set{var2, MACD (23,50,9) - MACD (23,50,9) 10 day low}
set{var3, var2 / range}
set{var6, cema(var3, 3) 10 day high}
set{var5, cema(var3, 3) 10 day low}
set{var7, cema(var3, 3) - var5}
set{var8, var6 - var5}
set{var9, var7 / var8}
set{var10, cema(var9, 3)}
set{STC, 100 * var10}
add column separator
draw STC and draw stc line at 25 and draw STC line at 75
]


For basic subs, I use Kevin's partial STC

Fetcher[

SYMLIST(GME)
chart-time 12 months

/**** PPO vs Schaff TC vs MACD *****/
optionable
chart time is 1 year
/********* daily PPO ********/
draw ppo(10,24)
set{DailyPPOsignal, cema(ppo(10,24), 8)}
draw DailyPPOsignal on plot ppo(10, 24)
/*********MACD**************/
draw MACD Slow Line(10,24,9)


/*
Post: THE SCHAFF TREND CYCLE INDICATOR
By: Kevin_in_GA
Date: 8/25/2010 at 4:11pm
URL: http://www.stockfetcher.com/forums/THE-SCHAFF-TREND-CYCLE-INDICATOR/1002/95838/-1/95838
*/


/*SCHAFF TREND CYCLE INDICATOR*/

set{var1, ema(23) - ema(50)}
set{highest, var1 20 day high}
set{lowest, var1 20 day low}
set{range, highest - lowest}
set{var2, var1 - lowest}
set{var3, var2 / range}
set{var4, var3 * 100}
set{stclong, cema(var4, 5)}

add column STClong

draw stclong line at 80
draw stclong line at 20
draw ema(23)

/*BUY WHEN STC CROSSES ABOVE 20*/
/*SHORT WHEN STC CROSSES BELOW 80*/
]


Mactheriverrat
3,135 posts
msg #155556
Ignore Mactheriverrat
modified
2/2/2021 10:54:57 PM

The markets remembers every thing. When GME showed up back in early Sept on the this Filter a Symlist could have been used as in drawing resistance levels . Then it popped up a few more time's before really breaking out on the 1-13-2021. Each time it hit high 20 day high that above average volume's happened. Then like I said on 1-13-2021 it broke resistance and it took off. Every time that it hit a new high off of resistance that the above average happened Volume = other traders. Finally the sellers lost all steam and it took off like a shooting star.

Submit
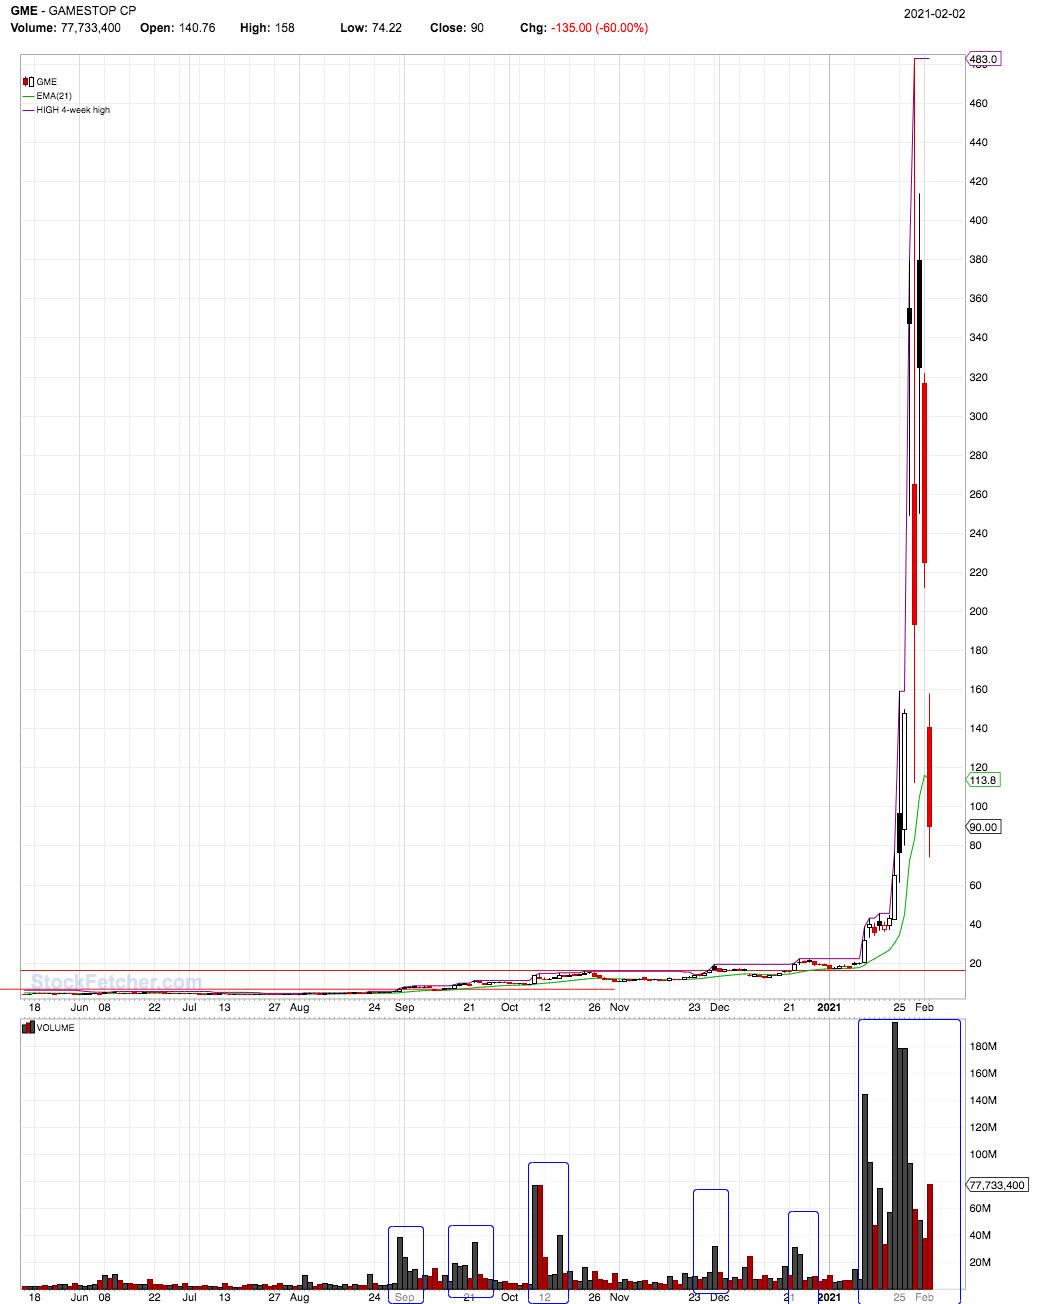
Fetcher[
show stocks where high 20 day high is above high 20 day high one day ago
market is not otcbb
market is not etf
Average Volume(30) is above 300000
add column Average Volume(30)
draw ema(21)
and price is below 50
and price is above 0.01
and Average Day Range(30) is above 5.00
do not draw Average Day Range(30)
add column Average Day Range(30)
]


Cheese
1,374 posts
msg #155561
Ignore Cheese
2/3/2021 1:06:27 AM

Good explanation, John(Mac).

miketranz
956 posts
msg #155564
Ignore miketranz
2/3/2021 9:03:05 AM

Nobody,look for stocks making a new 6 month low under $5,make up a watch list.Look to see which ones move in a flat line with low rsi.You're basically stalking stocks moving sideways which have not triggered a breakout.I would look also at volume/accumulation.This is a tedious process.ATOS would make a good model.AMC is also a good example.I'm sure someone on here has the smarts to come up with such a thing.It's really amazing the filters they come up with.A big thanks.Best,Miketraz...

miketranz
956 posts
msg #155566
Ignore miketranz
2/3/2021 9:55:26 AM

TTNP

Nobody
404 posts
msg #155569
Ignore Nobody
2/3/2021 10:35:01 AM

Thank You miketranz

xarlor
562 posts
msg #155570
Ignore xarlor
2/3/2021 10:46:14 AM

@miketranz and Nobody
Kinda, sorta?

This one catches ATOS and AMC and others along the way.

Fetcher[
/* miketranz suggests: look for stocks making a new 6 month low under $5,make up a watch list.Look to see which ones move in a flat line with low rsi.You're basically stalking stocks moving sideways which have not triggered a breakout.I would look also at volume/accumulation.
https://www.stockfetcher.com/forums/Stock-Picks/GameStop-Do-you-have-a-filter-that-found-it-When/155511/99999
*/
set{under5,count(close < 5,1)}

set{new_low1,count(close reached a new 6 month low,20)}
set{new_low,count(new_low1 >= 1,1)}

set{rsi_sideways1,count(rsi(14) < 50,30)}
set{rsi_sideways,count(rsi_sideways1 >= 20,1)}

set{rsi_breakout,count(rsi(14) reached a new 30 day high,1)}

set{ad_breakout,count(Accumulation Distribution reached a new 30 day high,1)}

set{sideways_breakout1,count(atr(15) < .2,30)}
set{sideways_breakout,count(sideways_breakout1 >= 8,1)}

set{buy1,under5 * new_low}
set{buy2,buy1 * rsi_sideways}
set{buy3,buy2 * rsi_breakout}
set{buy4,buy3 * ad_breakout}
set{buy,buy4 * sideways_breakout}
buy > 0
buy 1 day ago equals 0

draw RSI(14)
draw Accumulation Distribution
]


miketranz
956 posts
msg #155578
Ignore miketranz
2/3/2021 2:30:42 PM

APRE

StockFetcher Forums · Stock Picks and Trading · GameStop Do you have a filter that found it? When?<< 1 2 3 4 >>Post Follow-up

*** Disclaimer *** StockFetcher.com does not endorse or suggest any of the securities which are returned in any of the searches or filters. They are provided purely for informational and research purposes. StockFetcher.com does not recommend particular securities. StockFetcher.com, Vestyl Software, L.L.C. and involved content providers shall not be liable for any errors or delays in the content, or for any actions taken based on the content.


Copyright 2022 - Vestyl Software L.L.C.Terms of Service | License | Questions or comments? Contact Us
EOD Data sources: DDFPlus & CSI Data Quotes delayed during active market hours. Delay times are at least 15 mins for NASDAQ, 20 mins for NYSE and Amex. Delayed intraday data provided by DDFPlus


This site is protected by reCAPTCHA and the Google Privacy Policy and Terms of Service apply.