| StockFetcher Forums · Stock Picks and Trading · A Newbie's Journey | << 1 ... 42 43 44 45 46 ... 48 >>Post Follow-up |
| sandjco 648 posts msg #148987 - Ignore sandjco |
8/24/2019 9:14:36 AM The waiting is painful. Where will she blow? The battle for 280? 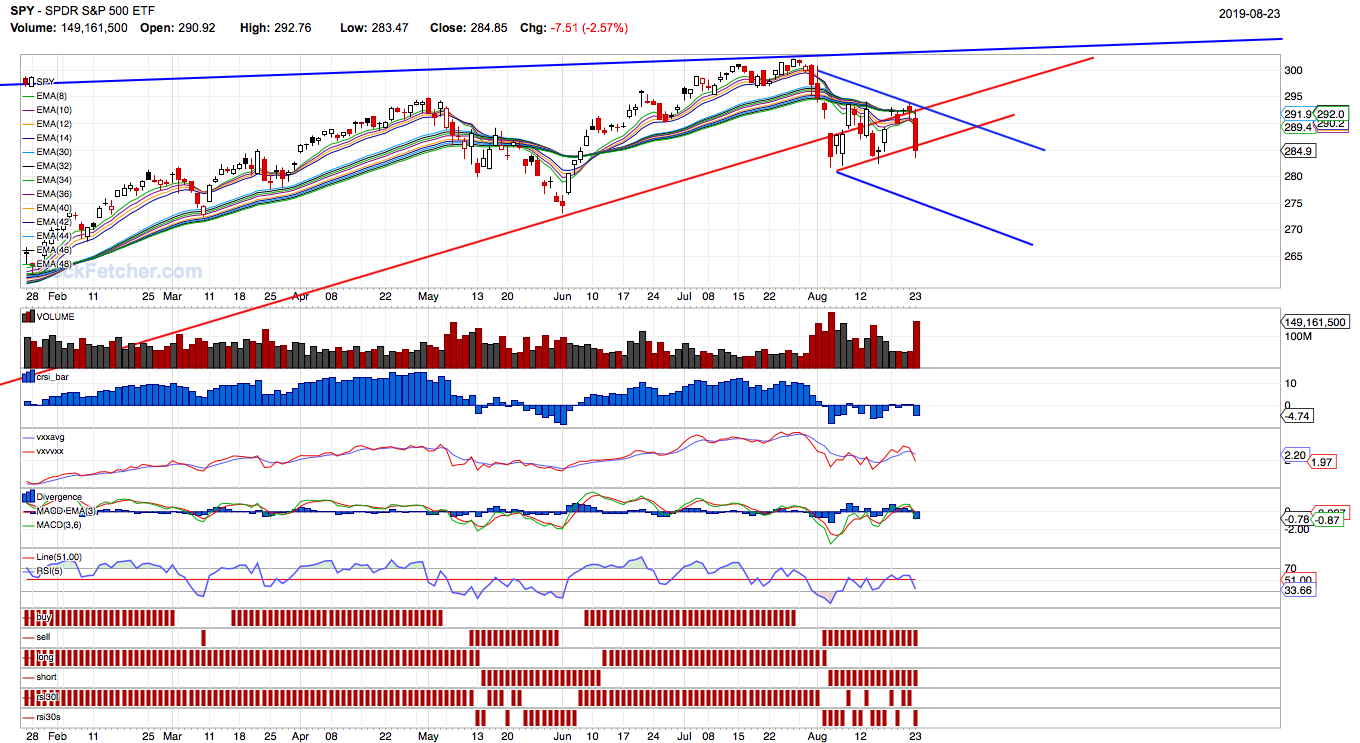 |
| sandjco 648 posts msg #149254 - Ignore sandjco |
10/1/2019 4:18:07 PM Will she tip? 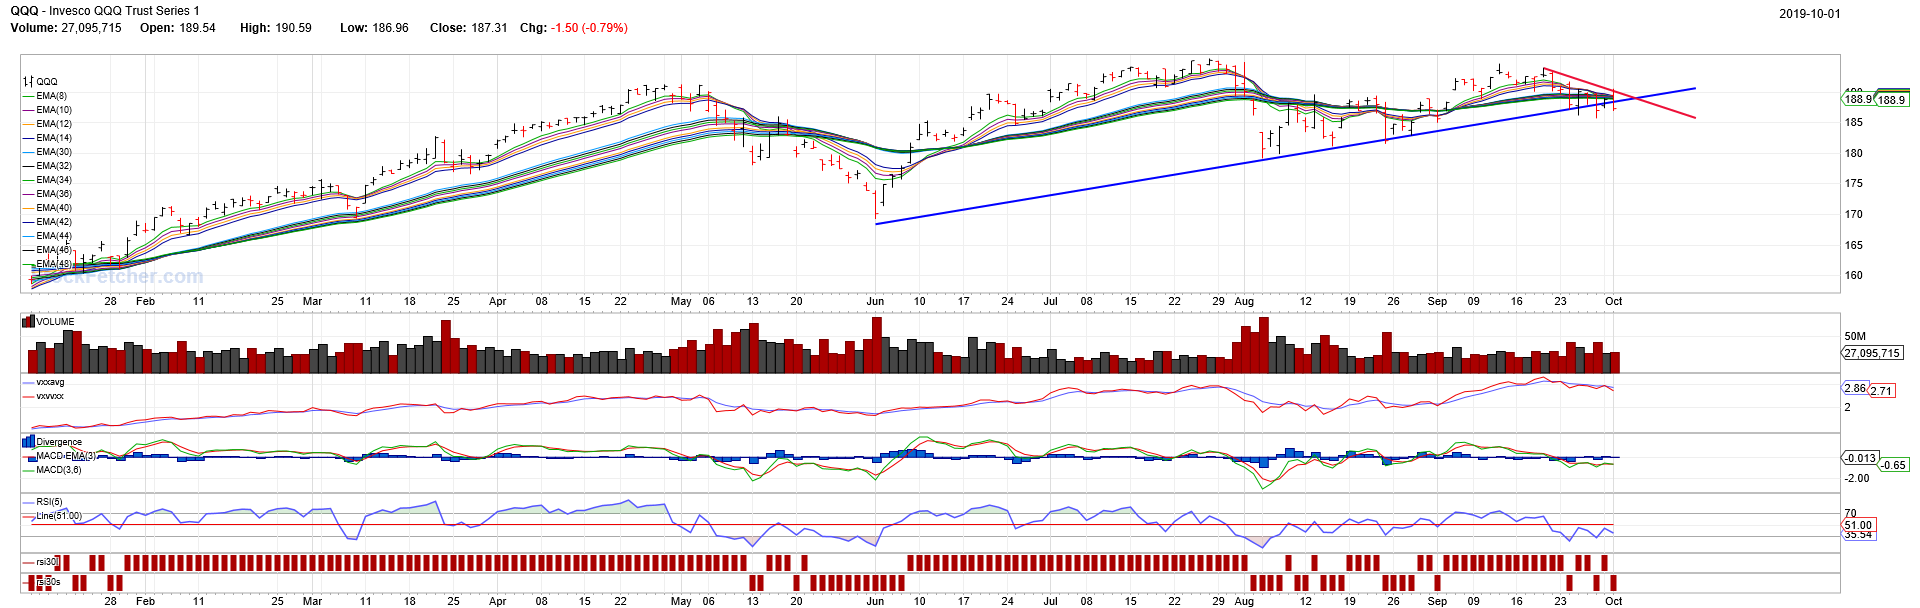 Bought QQQ 187P |
| shillllihs 6,102 posts msg #149255 - Ignore shillllihs |
10/1/2019 4:37:32 PM Naw I don't think so |
| sandjco 648 posts msg #149259 - Ignore sandjco |
10/2/2019 8:03:51 AM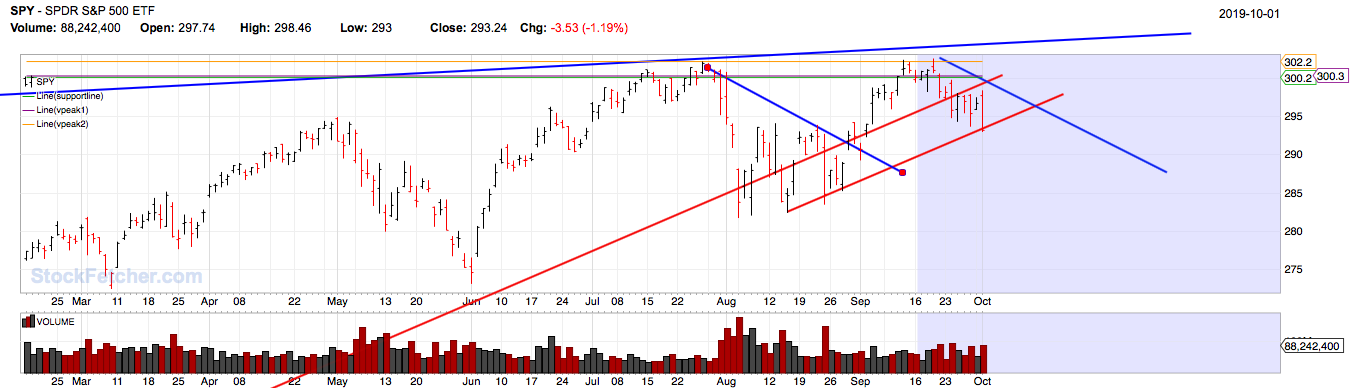 SPY Oct 283P |
| sandjco 648 posts msg #149264 - Ignore sandjco |
10/2/2019 3:07:29 PM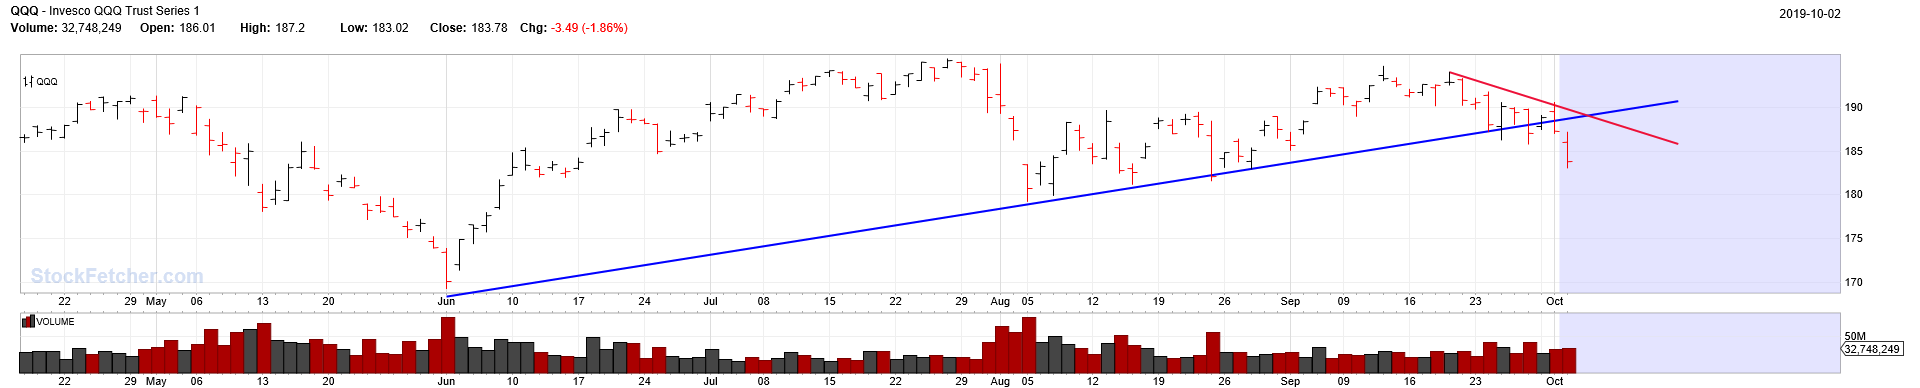 Thank you very much; was an easy 100% on the QQQ 187P SPY was no different 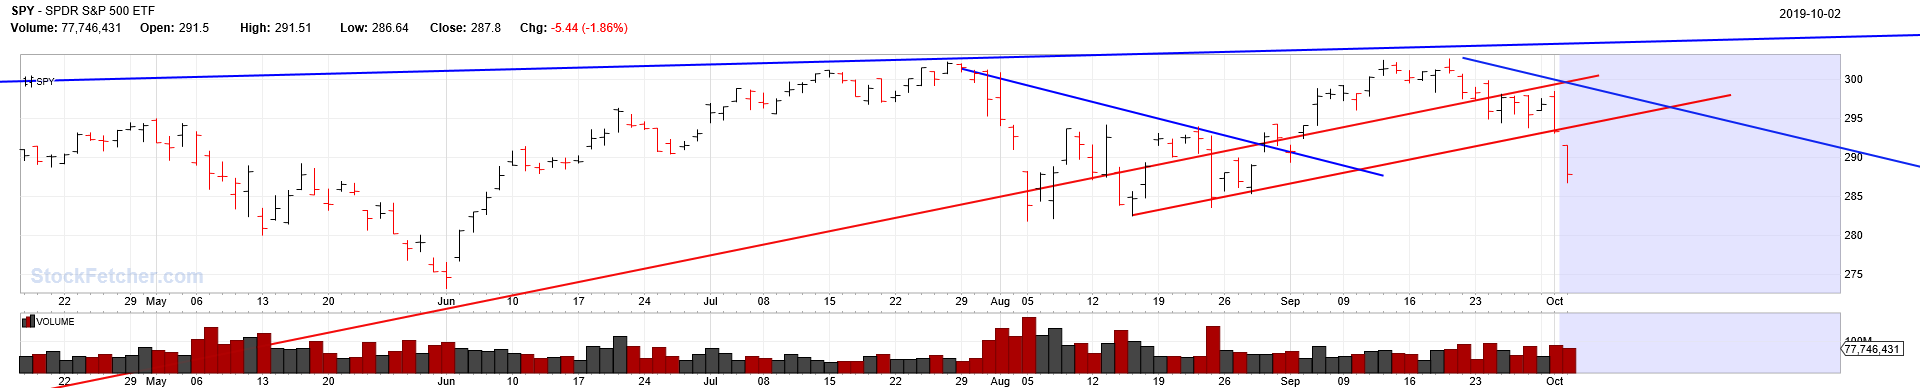 |
| shillllihs 6,102 posts msg #149265 - Ignore shillllihs modified |
10/2/2019 3:18:47 PM Nice, I didn't notice you had a put, I was saying spy wasn't ready to pop yet. |
| Cheese 1,374 posts msg #149280 - Ignore Cheese |
10/4/2019 4:40:58 PM sandjco 10/2/2019 3:07:29 PM Thank you very much; was an easy 100% on the QQQ 187P SPY was no different ================================================ Well done, sandjco. It's not the case of a blind squirrel finding a nut any more. You have some good charts behind those two puts. Were you able to capitalize on the bullish reversal of today? Which charts did you use for spotting reversals? |
| sandjco 648 posts msg #149283 - Ignore sandjco |
10/5/2019 12:15:18 PM Hi Cheese, I know you have been one of those kind people here at SF patiently giving me nuggets to think about...and would love nothing but to give back.... As much as I'd like to say I have a "secret sauce", I don't and believe it or not after 364 posts and countless of hours reading, I still am learning to find a way to trade "mechanically" without emotions. I am using Makhohs old filter and have tweaked it a bit using Fibo numbers (don't know why I find them fascinating). I do not have a system to "back test" any filters; I pretty much just eye ball them. I still don't have a "go to" filter or system. I guess you could say that I'm still confused lol! Sure miss the old days where there were quite a bit of post that you could learn from. As "luck" may have it, I did play the reversal as per the signal provided and bought Oct 25 191C at $1.15. Why luck? Aside from seeing the signal, I merely placed a low bid on the contracts while I went about my day. My logic was that it was close to support and RSI2 was oversold. I wasn't able to post the trade. i closed 80% of my position EOD Friday for another 100% but couldn't post so it don't count. I opened an initial position for Dec 197C at $2.50. I will be adding more if there is a follow thru Monday. The trade could have easily gone against me. Hence, I am still thinking there was some luck involved. As I'm not an option pro, I think I may be picking the wrong strikes or entries. I usually end up picking up what is cheap (as in less than $5/contract). So I continue to read and experiment not looking for the "holy grail"...but to understand and find my own path. QUESTION: do you know of a script wherein it would trigger when price crosses a trend line? For example, on the charts below..I've drawn a down trend line (red) and I'd like SF to automatically tell me which stocks have crossed down trend lines or say a flat resistance top Hope I've answered your question. 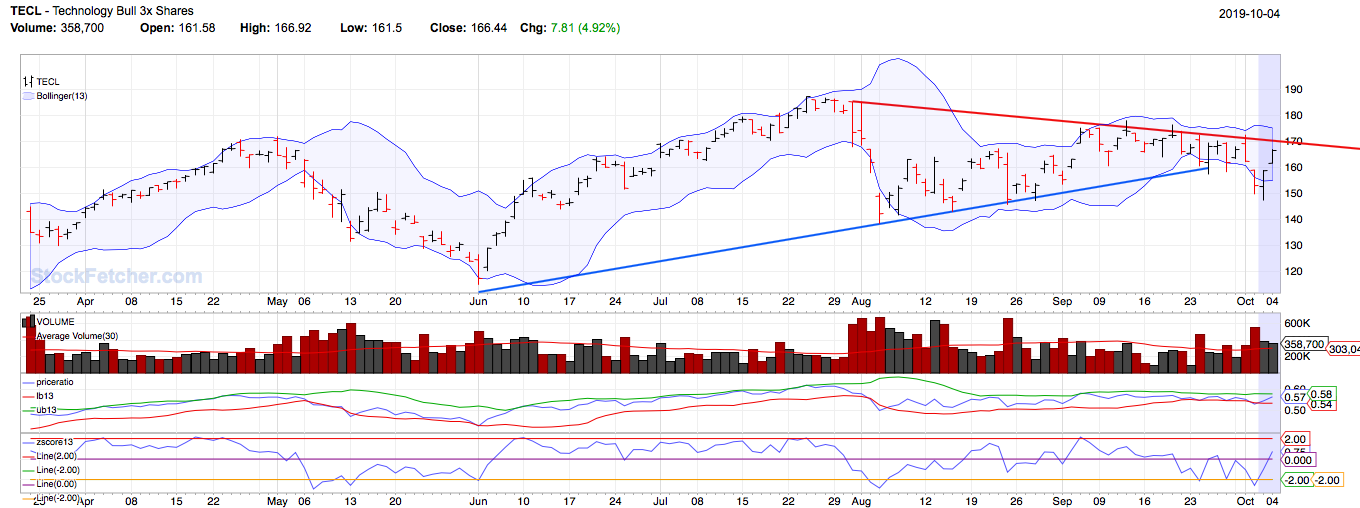 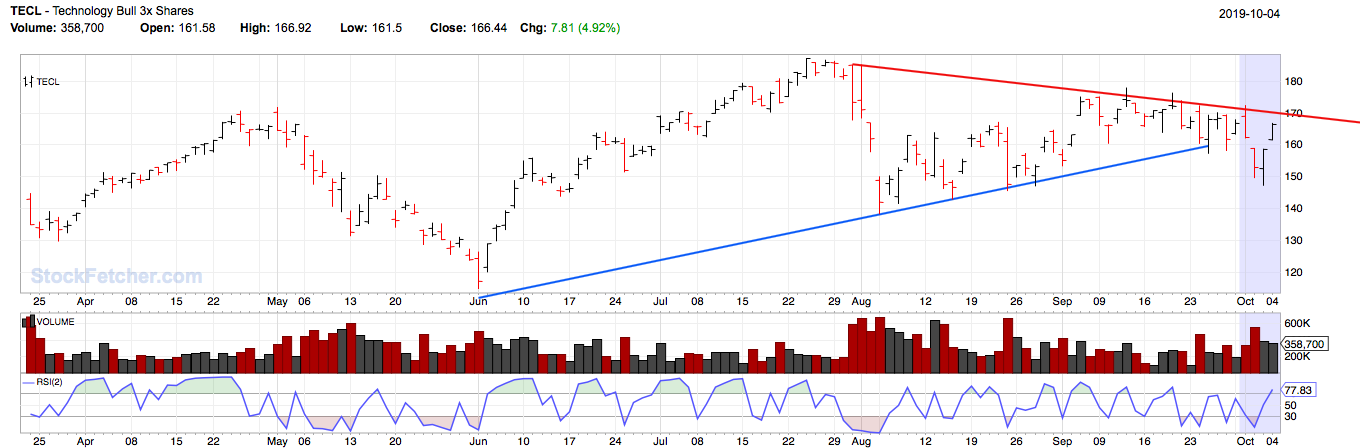 |
| Cheese 1,374 posts msg #149286 - Ignore Cheese |
10/5/2019 3:33:06 PM Thanks, sandjco. There is always a luck and chance factor, especially when everything can change with tweeting and jawboning. But first and foremost, I think you are very good with trading and risk management. Only price pays so you were certainly right in using rsi for your decisions on Fri Oct 4 . Here is a pinned tweet on Wed. Oct 2 by Thomas Lee, a well known money manager https://twitter.com/fundstrat/status/1179545118124253184 Watch S&P 500 daily RSI. Last 4 of 5 times, when it gets to below 30, it has marked end of selloff As for your automated alert question, I don't have a good answer rand I don't know anything about options. However, there are plenty of people here and at TradingView who should be able to help you, for example people like davesaint86, mahkoh, and many more. GLTY |
| xarlor 646 posts msg #149287 - Ignore xarlor |
10/5/2019 4:35:22 PM sandjco, there's probably better ways to find breaking trendlines, but this is what I use in my filters. Unfortunately, when looking back, the LRC always draws with today's data, instead of however long you're looking back. The filter is still showing correctly, it's just the LRC lines display based on today's data. Go back a month to see what I mean. Still, it does a reasonable job of showing a breakout of a trend. |
| StockFetcher Forums · Stock Picks and Trading · A Newbie's Journey | << 1 ... 42 43 44 45 46 ... 48 >>Post Follow-up |