| StockFetcher Forums · General Discussion · XIV | << 1 ... 8 9 10 11 12 ... 22 >>Post Follow-up |
| karennma 8,057 posts msg #141192 - Ignore karennma |
1/20/2018 9:47:56 AM Re: "/* LONGSHORT is number of consecutive days Longposition above (+)/below(-) previous Shortposition */ WHY is this important? |
| karennma 8,057 posts msg #141193 - Ignore karennma |
1/20/2018 10:04:10 AM Or better still, that vertical red line on the chart on msg #141184 ... If there were code to tell SF to draw that line when the trend flips .. WOW! That would be great. |
| Mactheriverrat 3,178 posts msg #141198 - Ignore Mactheriverrat modified |
1/20/2018 3:52:21 PM The red vertical line can be used in the pop up chart . Just change the color. Long and short is suggested when the dma(8,-5),8) and the cma(DMA(8,-5),8) intersect or make a crossover. Submit Submit Not trying to muddle this thread but I picked up WYNN using this code . over 10% gain in a week. Now like I posted before that there is NO Holy Grail but its not bad trigger I would say. 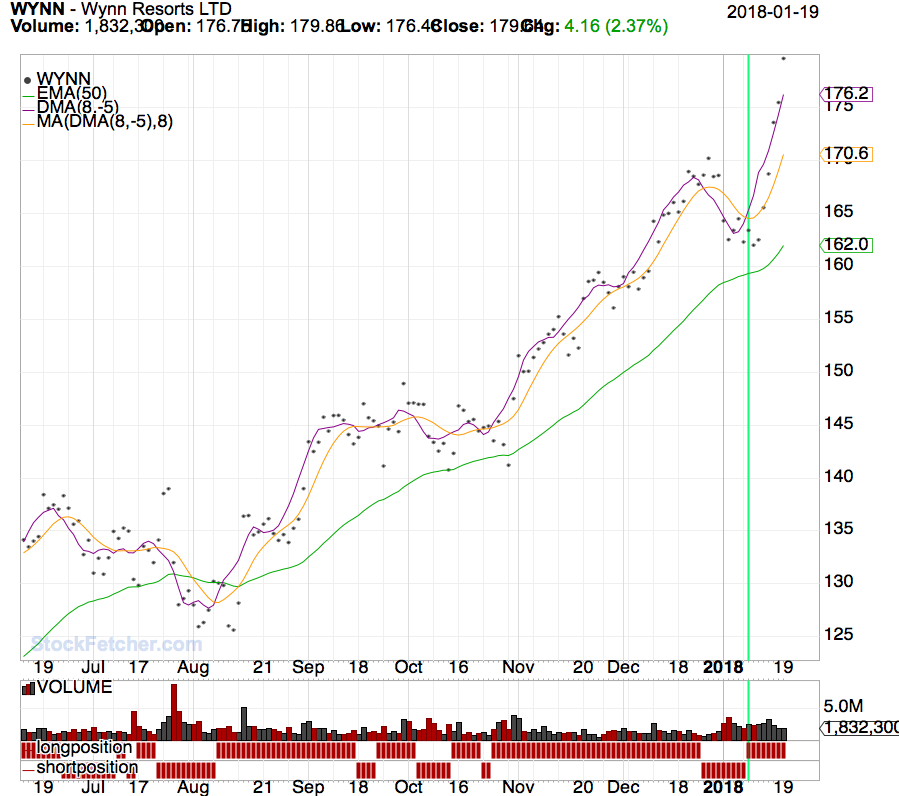 |
| karennma 8,057 posts msg #141202 - Ignore karennma |
1/20/2018 4:45:05 PM Mactheriverrat 1,363 posts msg #141198 - Ignore Mactheriverrat modified 1/20/2018 3:52:21 PM The red vertical line can be used in the pop up chart . Just change the color. Long and short is suggested when the dma(8,-5),8) and the cma(DMA(8,-5),8) intersect or make a crossover. ===================================== Red, green, blue ... whatever ... it's not automatic ... correct? I mean in the code, it doesn't say "draw this vertical line when the trend flips from ___ to __. BTW, HOW do you change the color? Is there code for that too? |
| karennma 8,057 posts msg #141203 - Ignore karennma |
1/20/2018 4:49:29 PM ** REPOSTING ** karennma 6,868 posts msg #141190 - Edit message 1/20/2018 9:40:08 AM That's nice to see the color graph at the bottom, but additionally, I was trying to display it as columns so I wouldn't have to look at all the charts (i.e., if I have 50 results). Does anyone know how to fix this, please? set{longposition, count(E3 > 0,1)} set{shortposition, count(E3 < 0,1)} add column longposition add column shortposition That doesn't work. But I'm no coding expert, so .... WTH. TIA! |
| davesaint86 726 posts msg #141206 - Ignore davesaint86 |
1/20/2018 6:07:48 PM Mach - Just got home from skiing. Just reason I asked about the dots is because if you look under Settings I do not see dots listed. I never new dots was a selection. Anyways, I finally found the dots. Follow the dots they will lead you to riches. |
| olathegolf 119 posts msg #141207 - Ignore olathegolf |
1/20/2018 7:08:36 PM I posted this on 1/12 but I think it's worth posting again. If you're using DMA, you need to know that it's really not possible to backtest. When glancing at any chart with the long/short triggers, it seems like the holy grail - but on further inspection, you'll notice that the tabular data (when using date offset) does not match the chart. Here was the SF response to my question: SF>The tabular value, when using the date offset, shows the DMA value as it was on that date.The issue you are experiencing is related to date offset and the StockFetcher chart that shows a continuous plot of the DMA to the current date. Further, I found the following link in SF Help: https://www.stockfetcher.com/help/Negative-Offset-Displaced-Moving-Average/100315 |
| Mactheriverrat 3,178 posts msg #141208 - Ignore Mactheriverrat |
1/20/2018 8:10:44 PM @ karennma The vertical lines are when you hit the pop up charts and hit where the color marker to change to any color you like.  |
| davesaint86 726 posts msg #141210 - Ignore davesaint86 modified |
1/20/2018 8:35:09 PM Thanks olathegolf, I understand. This is why I have secondary indicators in my filters also that I can use as confirmation. I just want to clarify something. It's my understanding that the cross over in the chart is accurate but the verticals bars can be off a little. Is that correct? |
| davesaint86 726 posts msg #141211 - Ignore davesaint86 |
1/20/2018 8:36:25 PM Cool Mach making money I Wynn. |
| StockFetcher Forums · General Discussion · XIV | << 1 ... 8 9 10 11 12 ... 22 >>Post Follow-up |