| StockFetcher Forums · General Discussion · XIV | << 1 ... 14 15 16 17 18 ... 22 >>Post Follow-up |
| davesaint86 726 posts msg #141806 - Ignore davesaint86 |
2/3/2018 12:07:20 PM Mac - do you think this downward move is about over? |
| Mactheriverrat 3,178 posts msg #141809 - Ignore Mactheriverrat |
2/3/2018 12:54:12 PM Well until cma(DMA(8,-5),1) cross above cma(DMA(8,-5),8) its still in a downward movement- Unless someone has a Holy Grail indicator IMHO! |
| davesaint86 726 posts msg #141810 - Ignore davesaint86 |
2/3/2018 1:03:58 PM Good answer! I should have asked based on analyzing previous down moves do you think we are close to a bottom in this downtrend? |
| pthomas215 1,251 posts msg #141811 - Ignore pthomas215 |
2/3/2018 1:08:58 PM and that cross could be the 97 support level. believe it or not. already lost 21% of it's value in a couple weeks. |
| Mactheriverrat 3,178 posts msg #141812 - Ignore Mactheriverrat |
2/3/2018 2:22:37 PM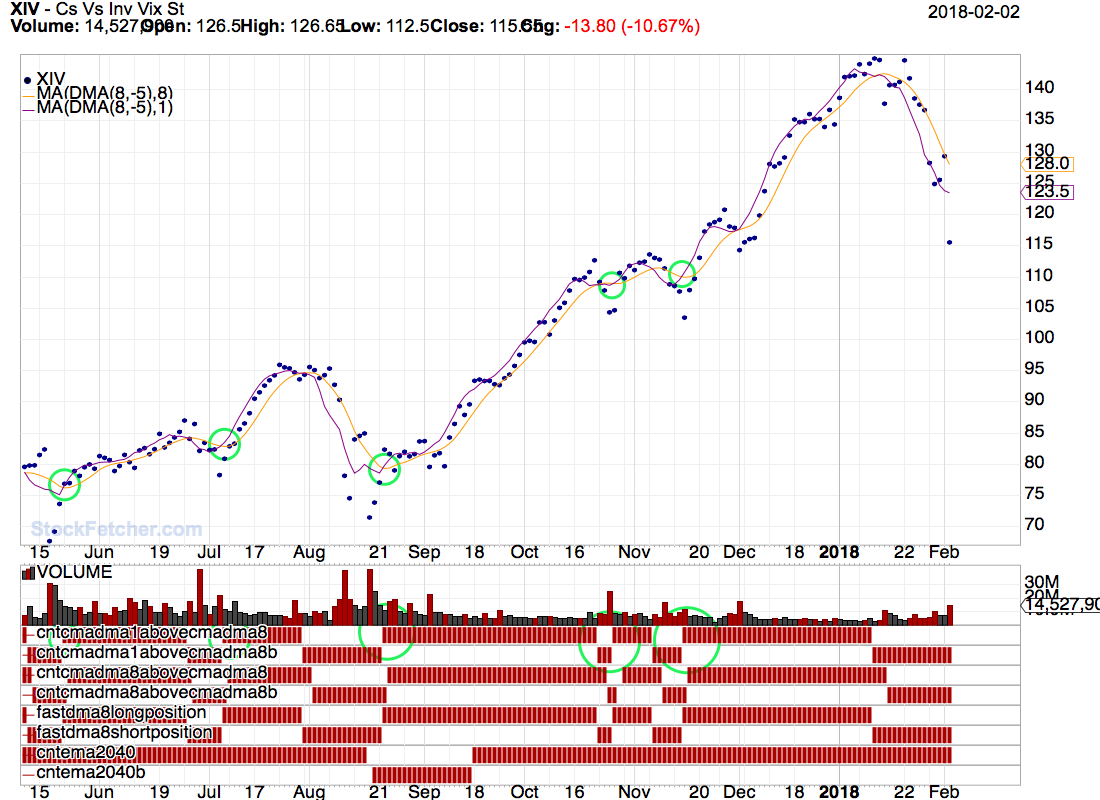 |
| davesaint86 726 posts msg #141814 - Ignore davesaint86 |
2/3/2018 7:16:01 PM I modified one of Kevin's Sharpe Allocation filters and embedded the code into my DMA8 filter. I do not know if it buys me anything. My goal is to find something that can get you in and out of a position faster when a trend changes abruptly. You can add whatever Bull/Inverse pair that you like to it (UGAZ/DGAZ, LABU/LABD, ZIV/VXZ, TMF/TMV, etc). I'm just playing around since I couldn't go skiing today. |
| davesaint86 726 posts msg #141815 - Ignore davesaint86 |
2/3/2018 7:20:02 PM Hedge 4-ETF Version |
| pthomas215 1,251 posts msg #141816 - Ignore pthomas215 |
2/3/2018 7:47:56 PM mac, it may stop at 105 but there is an additional support like if you go back to August...topped @ 97, then went back down to that exact level later. Just saying we may see an up day Monday but it would not surprise me if next week we dropped below 100 to 97 |
| davesaint86 726 posts msg #141822 - Ignore davesaint86 |
2/3/2018 9:16:49 PM Mac - Just noticed that you changed the code a little. Cool! |
| Mactheriverrat 3,178 posts msg #141826 - Ignore Mactheriverrat |
2/4/2018 1:02:51 AM @PT -Support levels are always good to watch. @Dave Roger that on the changed code cma(DMA(8,-5),1) cross above cma(DMA(8,-5),8) I've added do not draw dma(8,-5),8) but still keep watching it It seems that the cma(DMA(8,-5),1) and cma(DMA(8,-5),8) are a little slower and so far seem to be working well with each other. I just got out of WFC 2 days ago in my IRA on a cma(DMA(8,-5),1) cross below cma(DMA(8,-5),8) 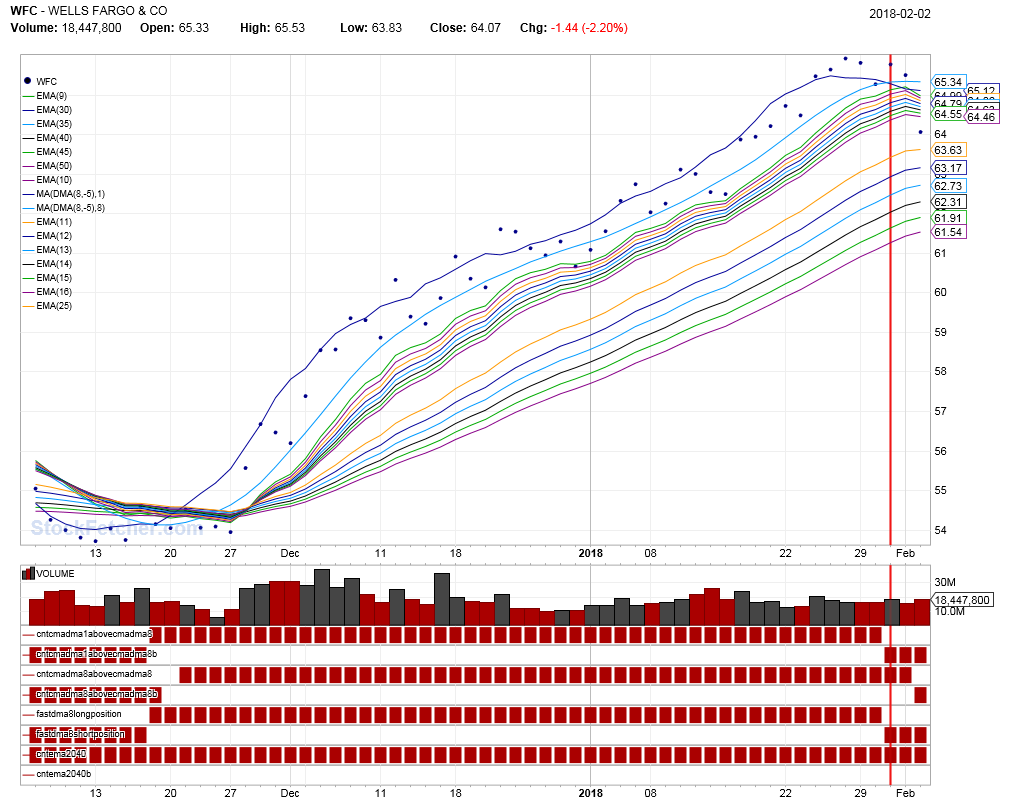 |
| StockFetcher Forums · General Discussion · XIV | << 1 ... 14 15 16 17 18 ... 22 >>Post Follow-up |