StockFetcher Forums · General Discussion · Price and what's really being said on the chart.<< >>Post Follow-up
Mactheriverrat
3,131 posts
msg #154253
Ignore Mactheriverrat
10/10/2020 2:12:37 AM

On Watch - Don't watch the price , what are the Guppy MMA'S saying on the chart?

nibor100
1,010 posts
msg #154271
Ignore nibor100
10/10/2020 5:10:15 PM

@Mac,

In case you haven't already tried this:

a. go to settings and eliminate the volume plot
b. Use the slider to resize the normal price chart to as small vertically as possible
c. After you run the mod of 1 of your recent filters, provided below, resize the Guppy MMAs window to as big as you like
d. Only drawback is most of your indicator charts that are below the Guppy chart will be just as big
e. I didn't test it on many symbols but I believe it should work on most, the scale is the challenge

Ed S.

Fetcher[
apply to symlist(spy,spwh)

draw ema(3) on plot var1
draw ema(4) on plot var1
draw ema(5) on plot var1
draw ema(6) on plot var1
draw ema(7) on plot var1
draw ema(8) on plot var1
draw ema(9) on plot var1
draw ema(10) on plot var1
draw ema(11) on plot var1
draw ema(12) on plot var1
draw ema(13) on plot var1
draw ema(15) on plot var1


draw ema(30) on plot var1
draw ema(31) on plot var1
draw ema(32) on plot var1
draw ema(33) on plot var1
draw ema(34) on plot var1
draw ema(35) on plot var1
draw ema(36) on plot var1
draw ema(37) on plot var1
draw ema(38) on plot var1
draw ema(39) on plot var1
draw ema(40) on plot var1
draw ema(41) on plot var1
draw ema(42) on plot var1
draw ema(43) on plot var1
draw ema(44) on plot var1
draw ema(45) on plot var1
draw ema(46) on plot var1
draw ema(47) on plot var1
draw ema(48) on plot var1
draw ema(49) on plot var1
draw ema(50) on plot var1

add column Average Day Range(30)
do not draw Average Day Range(30)

add column separator
chart-time is 3 months
market is not otcbb


Draw RSI(14) line at 70.00
Draw RSI(14) line at 60.00
Draw RSI(14) line at 50.00

/* rsi14xrsi14 is number of consecutive days rsi(14) above (+)/below(-) previous 50.00 */
set{rsi14rsi14b,days( rsi(14) is above 50.00 ,250)}
set{rsi14rsi14a,days( rsi(14) is below 50.00 ,250)}
set{rsi14-50, rsi14rsi14a - rsi14rsi14b} and add column rsi14-50 {rsi14-50}

Set{cntrsi14above50line,count( rsi(14) > 50.00 1day ago,1)}
draw cntrsi14above50line

Set{cntrsi14above50lineb,count( rsi(14) < 50.00 1day ago,1)}

draw cntrsi14above50lineb

add column separator


/* e513 is number of consecutive days ema(5) above (+)/below(-) previous eMA(13) */
set{e513b,days( ema(5) is above eMA(13) ,250)}
set{e513a,days( ema(5) is below eMA(13) ,250)}
set{e513, e513a - e513b} and add column e513 {e513}

Set{cnt513,count( ema(5) > ema(13) ,1)}
draw cnt513

Set{cnt513b,count( ema(5) < ema(13) ,1)}

draw cnt513b

/* 313 is number of consecutive days ema(3) above (+)/below(-) previous EMA(13) */
set{313b,days( ema(3) is above EMA(13) ,250)}
set{313a,days( ema(3) is below EMA(13) ,250)}
set{313, 313a - 313b} and add column 313 {313}

Set{cntema3ema13cross,count( ema(3) > ema(13) ,1)}
draw cntema3ema13cross
Set{cntema3ema13crossb,count( ema(3) < ema(13) ,1)}
draw cntema3ema13crossb
add column separator

Draw weekly IFT(2,4)
draw weekly ift(2,4) line at 0.0000
draw weekly ift(2,4) line at 0.90
draw weekly ift(2,4) line at -0.90

and weekly IFT(2,3) is below 1.00
draw weekly ift(2,3) line at 0.0000
draw weekly ift(2,3) line at 0.90
draw weekly ift(2,3) line at -0.90


draw weekly ift(2,2) line at 0.0000
draw weekly ift(2,2) line at 0.90
draw weekly ift(2,2) line at -0.90

draw weekly ift(2,1) line at 0.0000
draw weekly ift(2,1) line at 0.90
draw weekly ift(2,1) line at -0.90

Draw weekly RSI(2) on plot RSi(14)
draw weekly RSI(2) line at 50.00


set{momo,cema(momentum(16),5)}

draw momo
plottype{momo,zerobar}

set{var1,10 + high 252 day high}
do not draw var1
]


Mactheriverrat
3,131 posts
msg #154275
Ignore Mactheriverrat
10/10/2020 10:11:32 PM

I took
and weekly IFT(2,3) is below 1.00
off that symlist filter.

nibor100
1,010 posts
msg #154276
Ignore nibor100
10/10/2020 11:25:49 PM

Did you take a look at the resulting chart that only has Guppy mmas and no PRICE data?

thanks,
Ed S.

Mactheriverrat
3,131 posts
msg #154280
Ignore Mactheriverrat
10/11/2020 12:26:53 AM

Looks great ED.
Yes it doesn't show volume but I would like where it doesn't show price.
But that's just me.

xarlor
561 posts
msg #154282
Ignore xarlor
10/11/2020 10:41:58 AM

That's the beauty of nibor's filter above. It draws the guppys in its own chart, below the volume bars, but without price as you wished. It's quite ingenious. Your recent favorites are below: SPY, HOME, and SPWH.
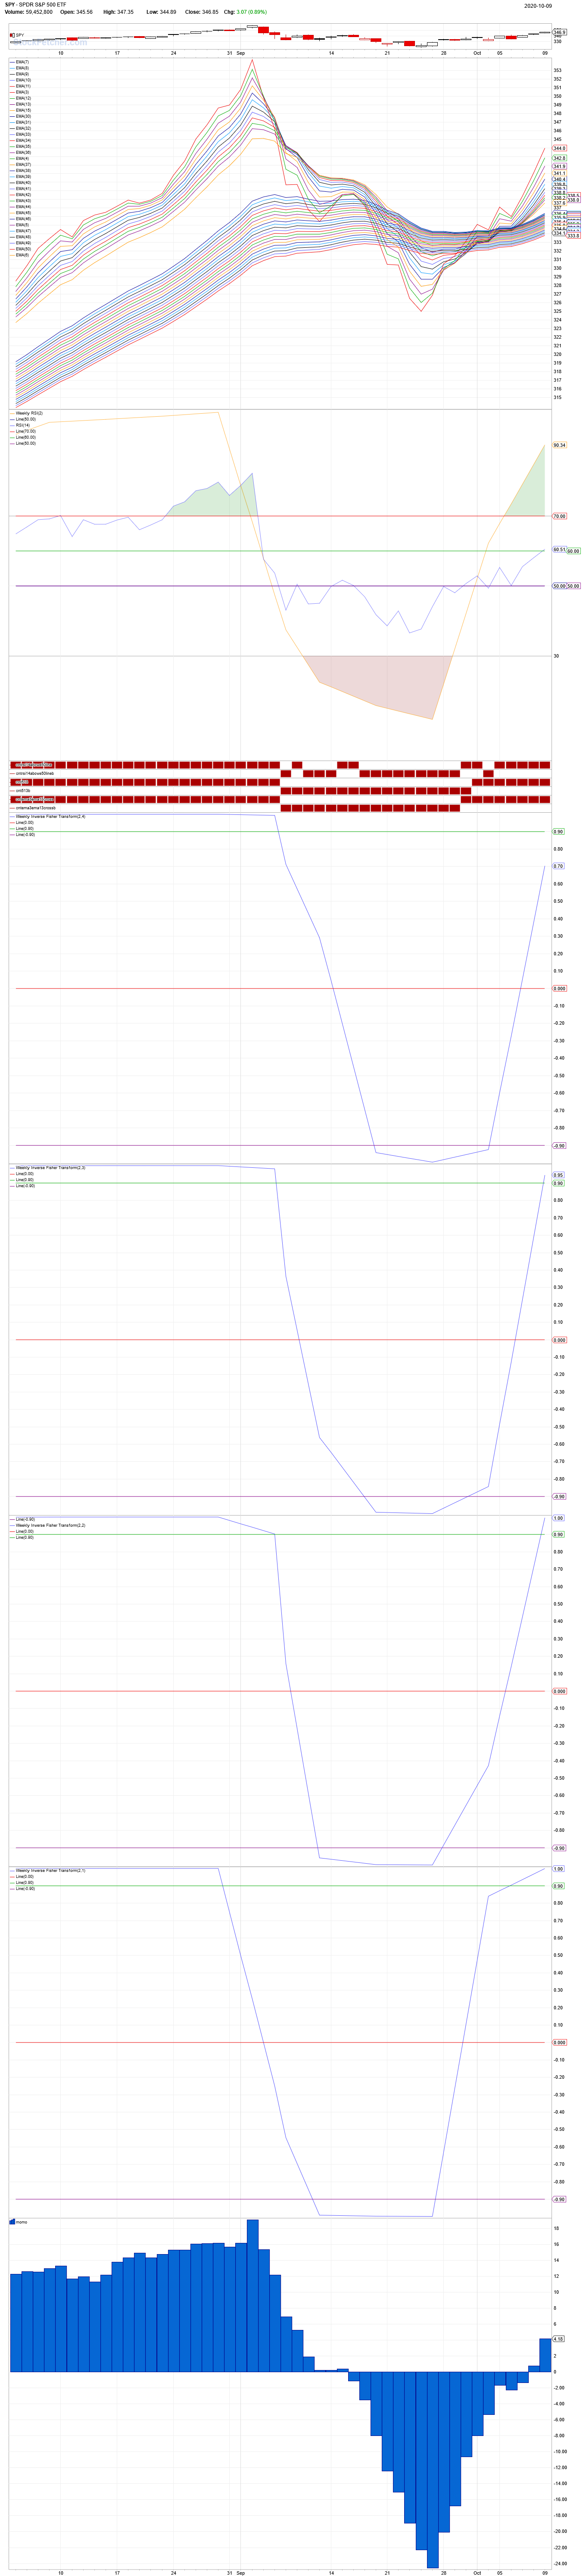
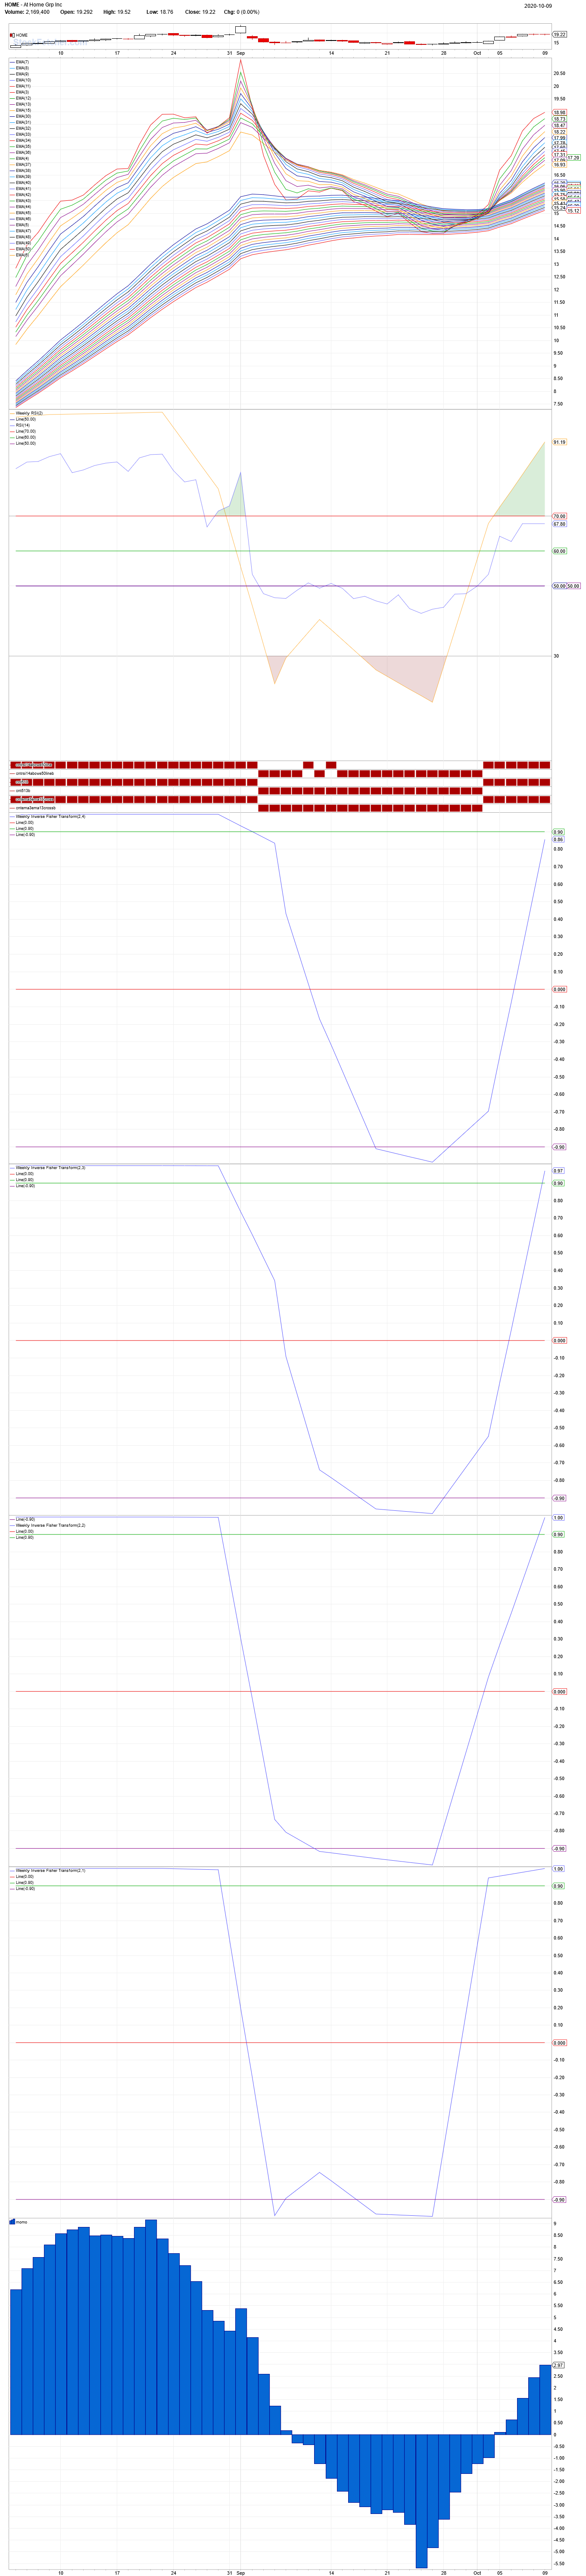
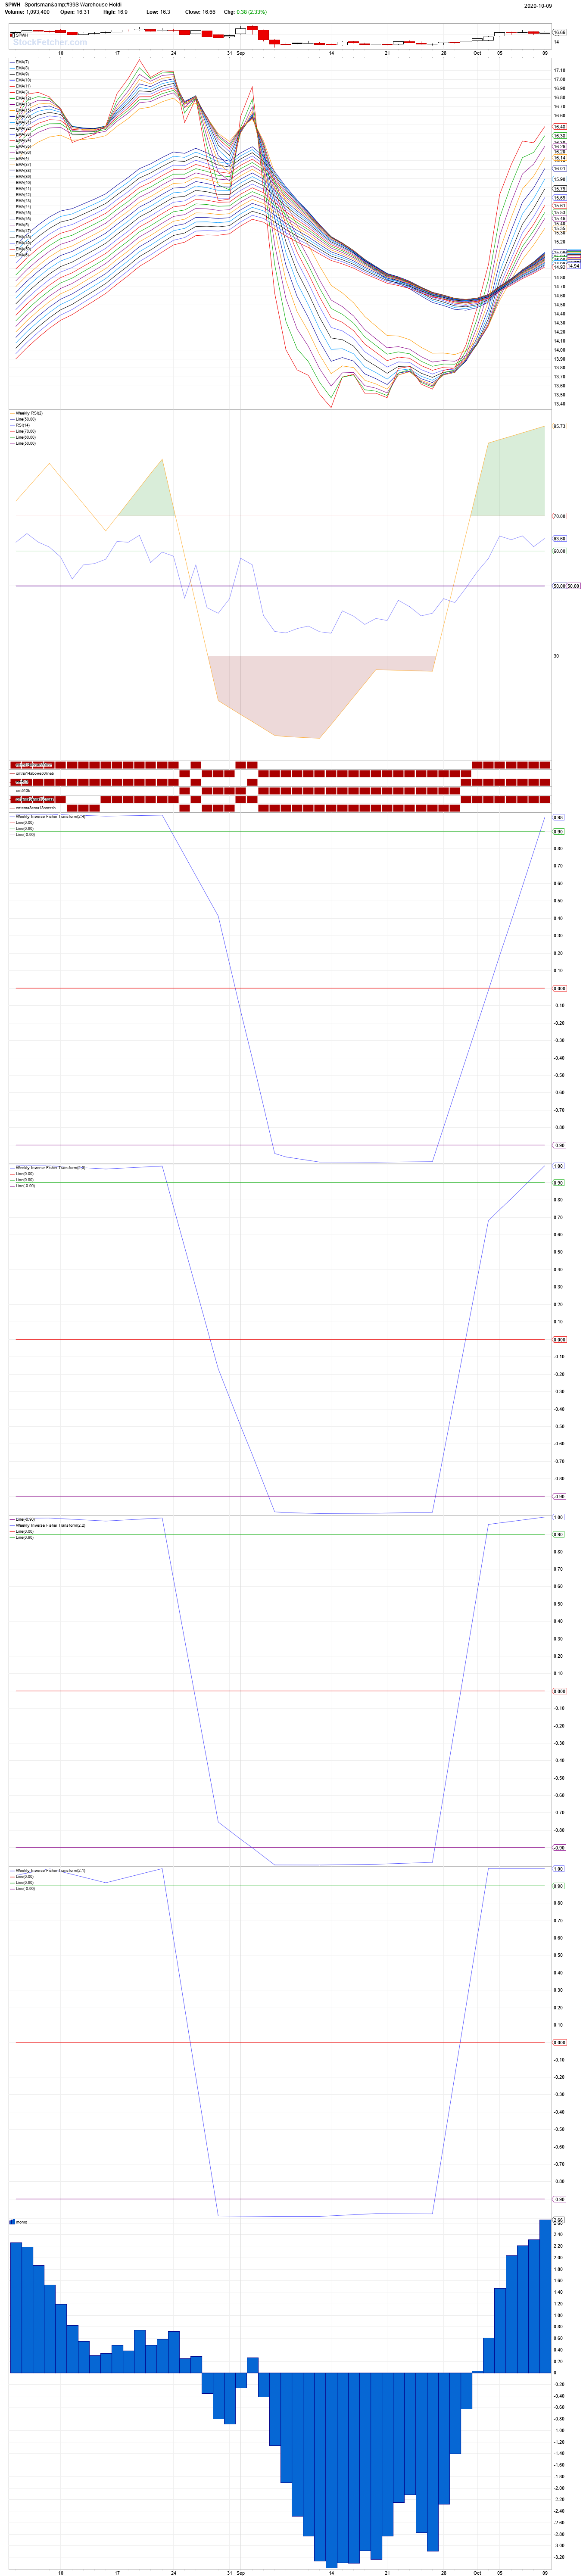


Mactheriverrat
3,131 posts
msg #154286
Ignore Mactheriverrat
10/11/2020 12:58:46 PM

Yes Xarlor it is very ingenious of the way Ed filter runs. I've seen it done a few times in some of SF very old posts . Just never clicked in my mind about it.

Great code .

Thanks again ED!!!!!!!!!!

nibor100
1,010 posts
msg #154287
Ignore nibor100
10/11/2020 2:01:47 PM

Most of the credit goes to the SF user manual page 151 for the DRAW ON phrase.
Ed S.


StockFetcher Forums · General Discussion · Price and what's really being said on the chart.<< >>Post Follow-up

*** Disclaimer *** StockFetcher.com does not endorse or suggest any of the securities which are returned in any of the searches or filters. They are provided purely for informational and research purposes. StockFetcher.com does not recommend particular securities. StockFetcher.com, Vestyl Software, L.L.C. and involved content providers shall not be liable for any errors or delays in the content, or for any actions taken based on the content.


Copyright 2022 - Vestyl Software L.L.C.Terms of Service | License | Questions or comments? Contact Us
EOD Data sources: DDFPlus & CSI Data Quotes delayed during active market hours. Delay times are at least 15 mins for NASDAQ, 20 mins for NYSE and Amex. Delayed intraday data provided by DDFPlus


This site is protected by reCAPTCHA and the Google Privacy Policy and Terms of Service apply.