| StockFetcher Forums · General Discussion · Can someone please clarify to me why the DMA is so significant? | << 1 2 3 >>Post Follow-up |
| BlackBars 54 posts msg #143532 - Ignore BlackBars |
5/11/2018 8:11:05 PM Plain and straightforward, why is the DMA such a popular tool on this forum? I am aware that it is a negativity displaced moving average, but what is it so noteworthy about it? |
| SAFeTRADE 661 posts msg #143535 - Ignore SAFeTRADE |
5/12/2018 2:04:33 PM Nothing. Do you trade in the past? Return same average. |
| four 5,087 posts msg #143536 - Ignore four modified |
5/12/2018 2:45:56 PM Displaced Moving Average - DMA Nice discussion: https://tradingsim.com/blog/displaced-moving-average/ Use: Another attempt to "match the moving average with the trend line in a better way" -- No sarcasm. There are 1000s of indicators and then 1000s more derivatives on the original indicators. To each their own. Trade for profit means use what works for your method, risk level, comfort zone, ... |
| Mactheriverrat 3,178 posts msg #143538 - Ignore Mactheriverrat modified |
5/12/2018 4:15:01 PM Best viewed in OHCL bars Submit 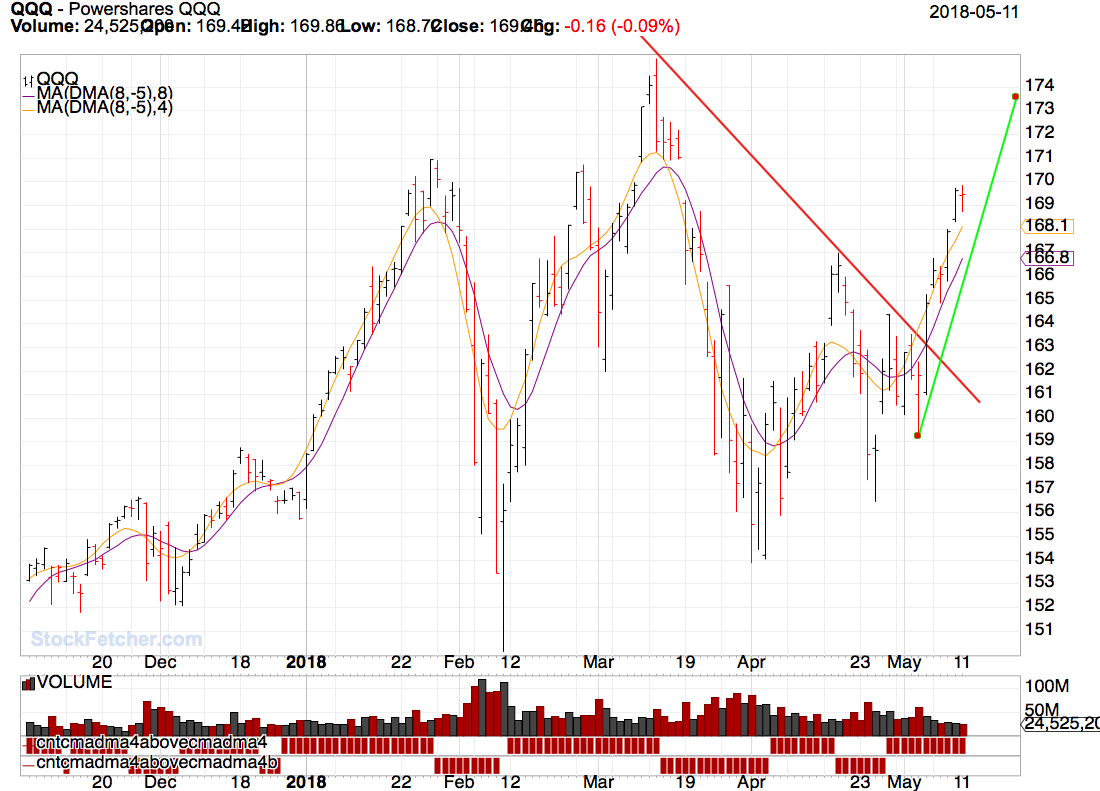 |
| VenturaTrader 45 posts msg #143542 - Ignore VenturaTrader |
5/13/2018 10:24:20 PM Many thanks to Mac for posting this filter and all of his generous postings. There has been much interest in the DMA on these forums. The Might Riggs thought his DMI (28-14) was the holy grail. Four posted a nice DMI filter with which to trade ETFs. The DMI back-tests very nicely and the results are very good, but they are not accurate. For several months I paper traded JNUG and JDST and I ran a spread sheet for several months. I gave up on trading the DMI because it did not produce good results. The problem with the DMI is if you record the DMI on a certain day, the allow five days or so to pass, the results for that certain day will sometimes change because the MA is displaced. The Might Riggs DMI (28-14) was concluded to actually be at 14 day MA. The only way to conclude if MAC has solved the "displaced problem" is to follow the signals in MAC's filter to determine if signals change on a certain day several days later. I will follow this filter trading QLD to see if the signals change after they fire. Mike |
| BlackBars 54 posts msg #143552 - Ignore BlackBars |
5/14/2018 6:05:59 PM I appreciate the responses, however it seems that I am still misunderstanding something. Why is the displacement aspect on SF not even displaced?? Four, I read the article and I am aware of its essential use for trading, however why is it considered so superior on this forum compared to all the other tools and scripts offered? Mactheriverrat, Can you please explain the logistics of your chart, I understand the bullish and bearish shown(obviously), but why is it not even displaced?? |
| Mactheriverrat 3,178 posts msg #143555 - Ignore Mactheriverrat modified |
5/14/2018 10:14:30 PM When cma(DMA(8,-5),4) makes a cross above cma(DMA(8,-5),4). It means trend is changing to a uptrend. Not sure why it isn't displaced as far as showing up on the SF charts. |
| TRMX 3 posts msg #143556 - Ignore TRMX |
5/14/2018 10:21:41 PM As MIke VenturaTrader said Sadly the signals change after they fire |
| Mactheriverrat 3,178 posts msg #143557 - Ignore Mactheriverrat |
5/14/2018 10:24:05 PM IMHO! INSY had a cma(DMA(8,-5),4) cross above cma(DMA(8,-5),8) with Bollinger width at a 6 month low. Bollinger band squeeze. 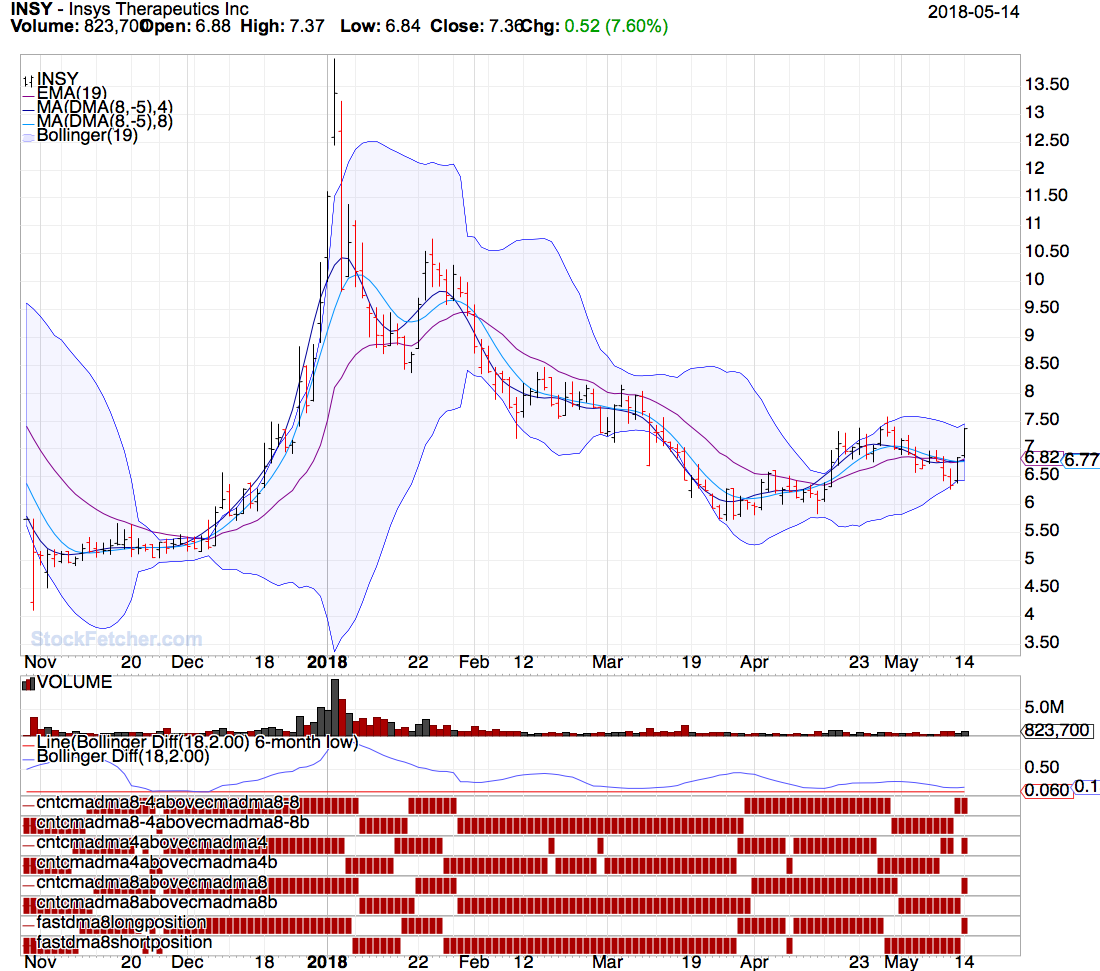 Study the cma(DMA(8,-5),4) cross above cma(DMA(8,-5),8) symlist that I posted and add different stocks. Its not the Holy grail but its made me some $. |
| VenturaTrader 45 posts msg #143558 - Ignore VenturaTrader |
5/14/2018 10:40:37 PM Mac said, "Its not the Holy grail but its made me some $." Like I said the DMA back tests really well. Using Mac's filter, if you only traded QDL and QID (long and short ETFs for the Qs) since the beginning of the year, you would be up more than 71% with no negative trades. That sounds really good! The only way to test this out is to paper trade this for awhile to see if the signals change after they fire. I am glad Mac is making some money and many thanks for him sharing his strategy. Mike |
| StockFetcher Forums · General Discussion · Can someone please clarify to me why the DMA is so significant? | << 1 2 3 >>Post Follow-up |