| StockFetcher Forums · Filter Exchange · Intersecting 1 month high with daily candle | << 1 2 >>Post Follow-up |
| Mactheriverrat 3,178 posts msg #147385 - Ignore Mactheriverrat |
4/14/2019 12:24:51 PM I use the high 20 DAY HIGH for finding stocks that have the first breakout. Then using the ema13 above ema13 one day ago along with high 20 DAY HIGH line for finding stocks about to breakout again. MRVL is a prime example. 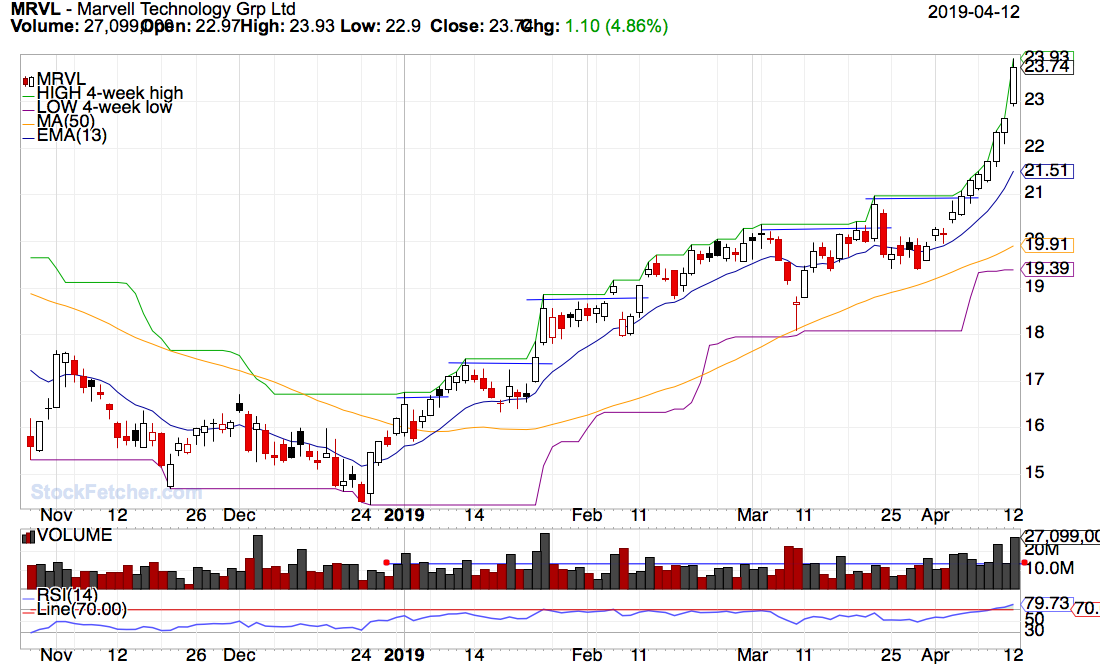 and another picture of MRVL using Guppy MMA's with the ema13 above ema13 one day ago along with high 20 DAY HIGH line. The ema13 is in the traders group . But with Guppy it shows a good example of trend changes new breakouts . Sometimes the pre breakout even show up as Bullish ascending triangles. 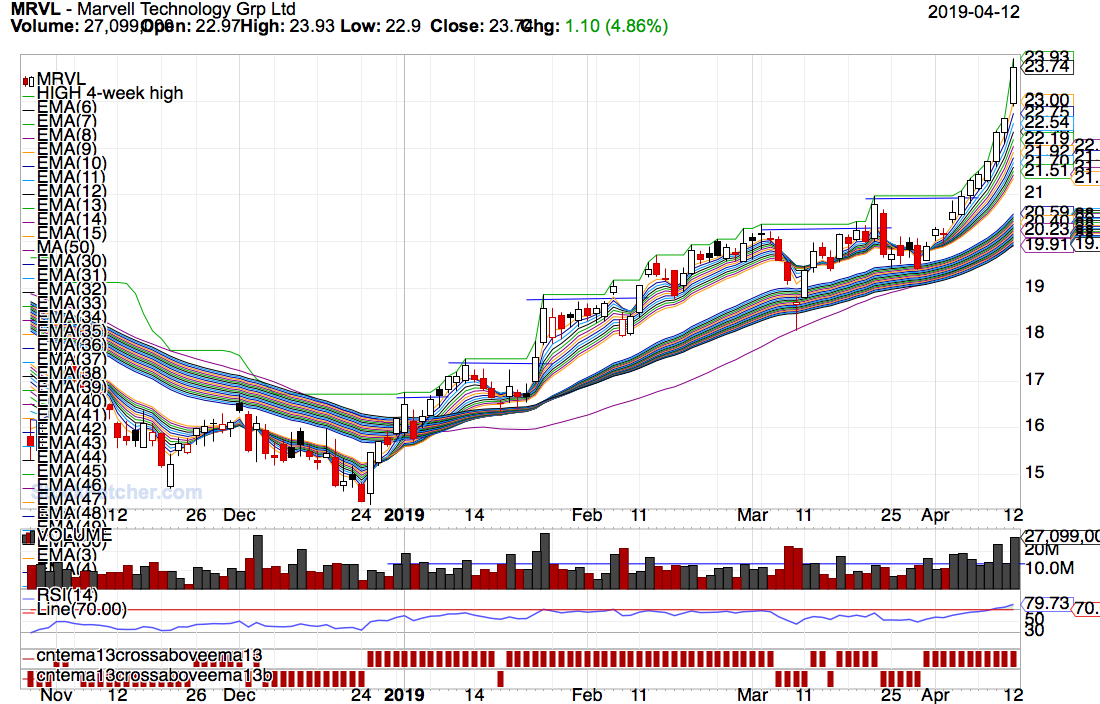 |
| Mactheriverrat 3,178 posts msg #147388 - Ignore Mactheriverrat |
4/14/2019 4:11:54 PM As for eBay thats just part of investing. It could never get above resistance of the 38 to 39 level. It may come back but after breaking below the ema13 bets are off and go on to the next stock. |
| Mactheriverrat 3,178 posts msg #147389 - Ignore Mactheriverrat |
4/14/2019 5:14:45 PM Just a quick glance of the filter I posted from page 1 with the highest volume to the lowest volume. I came across MSFT and a Bullish Ascending Triangle. Now its on my watch list and if breaks above the resistance which its right above it as of Friday it would be a good Breakout. 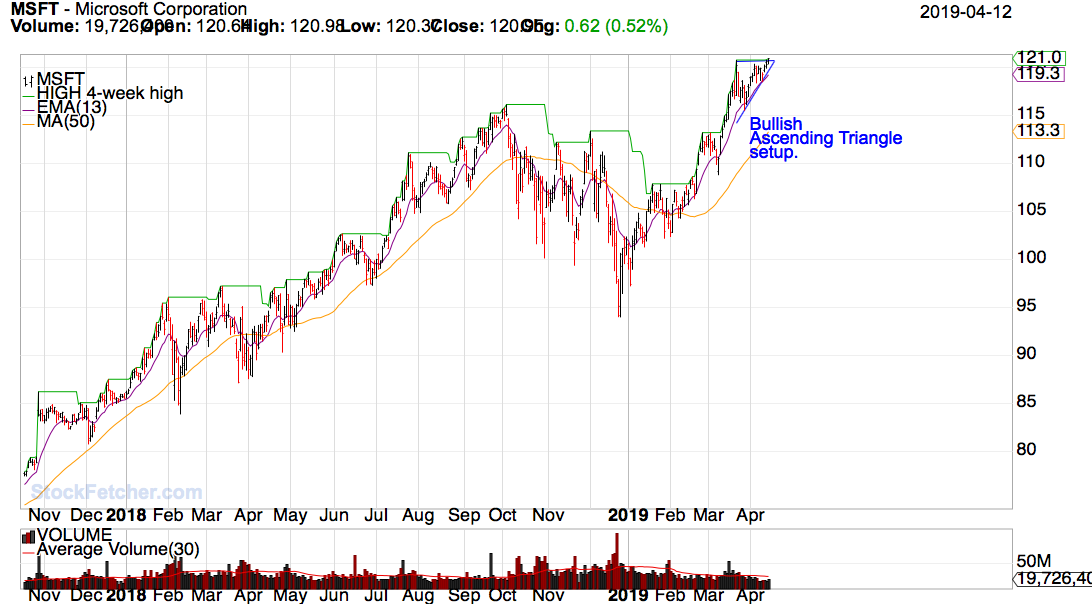 I try not to put much indicators ( maybe rsi14) on a filter because before you know your over analyzing and paralysis analysis. IMHO! |
| snappyfrog 753 posts msg #147390 - Ignore snappyfrog |
4/15/2019 6:30:13 AM Nice Mac. I agree, too many indicators is never a good thing. I do love that Stoch(40,40,4). It helps me to find major changes and keeps me in a trade without all the price noise many times. In the example of EBAY, it told me to get out of EBAY when it made the last 1 month high. Stoch gave me a cross down, so I would not have been trading it anyway.. Thanks for posting examples of your trading style. |
| dangreene 229 posts msg #147391 - Ignore dangreene |
4/15/2019 9:54:35 AM snappyfrog, This may be what you are looking for. |
| Mactheriverrat 3,178 posts msg #147398 - Ignore Mactheriverrat modified |
4/15/2019 6:59:00 PM Nice filter dangreene. Looks like you have been here a lot of years. On a side note- MSFT was up today by a hair. |
| Mactheriverrat 3,178 posts msg #147416 - Ignore Mactheriverrat |
4/16/2019 2:42:39 PM CENX - Ascending Triangle Breakout 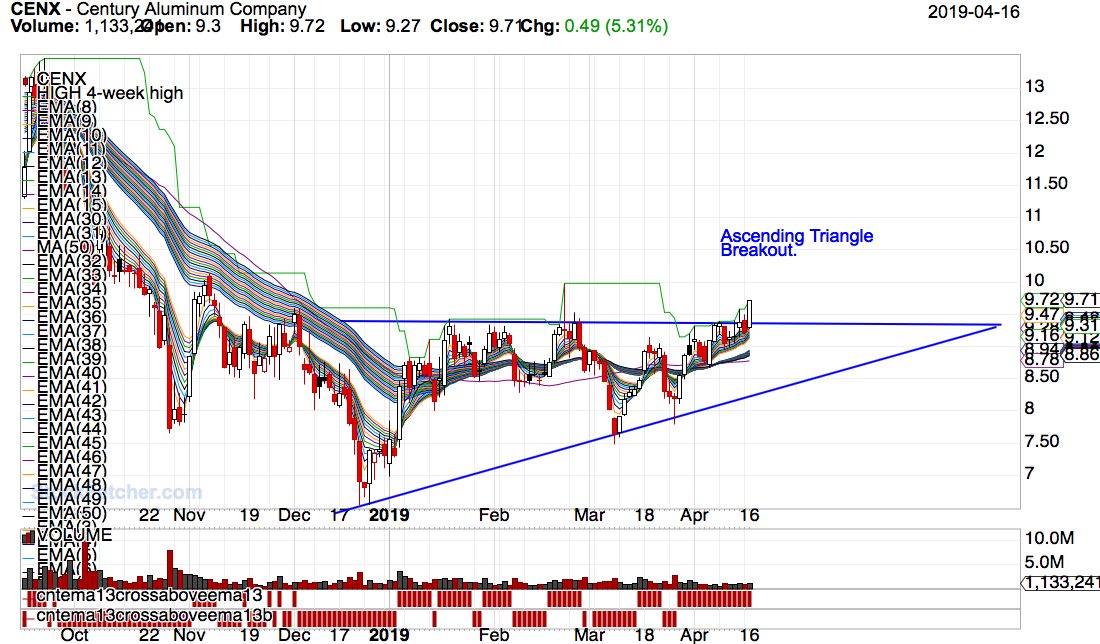 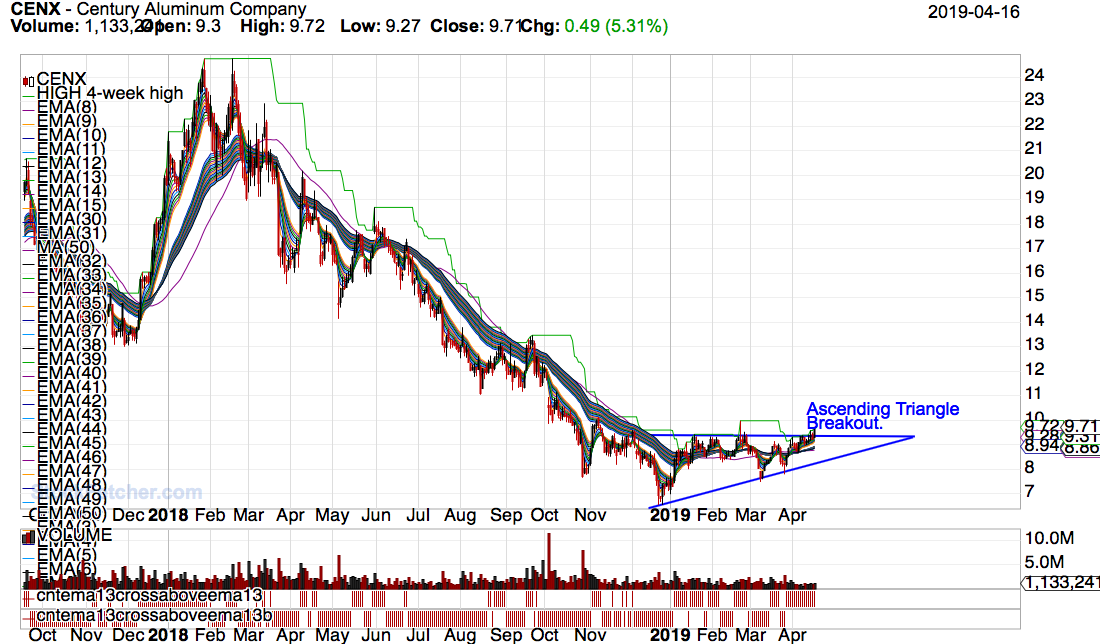 |
| Mactheriverrat 3,178 posts msg #147454 - Ignore Mactheriverrat |
4/18/2019 11:11:44 PM CENX broke down, MSFT panned out. 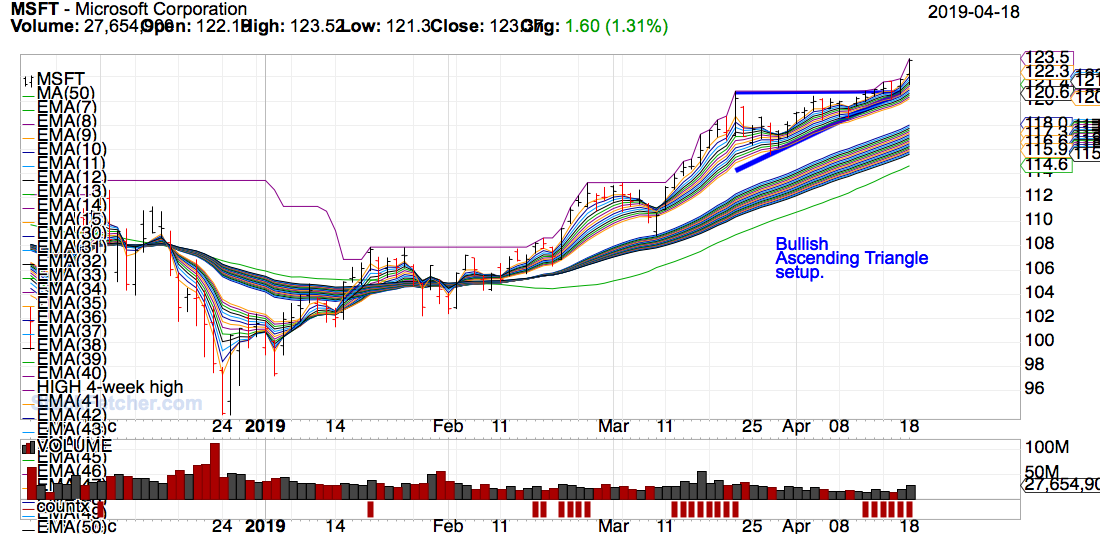 |
| Mactheriverrat 3,178 posts msg #147632 - Ignore Mactheriverrat |
5/1/2019 2:07:07 AM Posted MSFT Ascending triangle breakout setup and now this is what happens when it breaks out.  |
| StockFetcher Forums · Filter Exchange · Intersecting 1 month high with daily candle | << 1 2 >>Post Follow-up |