| StockFetcher Forums · Filter Exchange · DEADLY COMBO | << 1 ... 17 18 19 20 21 >>Post Follow-up |
| Mansor 78 posts msg #143777 - Ignore Mansor |
6/12/2018 1:25:05 PM 15.33 great call I'm in the process of opening account at ustocktrade (no option, no margin, no short, no pdt req. with 1$/transaction) cause ToS is getting expensive by the minute. |
| Mansor 78 posts msg #143778 - Ignore Mansor |
6/12/2018 1:36:18 PM After some advise I added pthomas215 scan with 13th & rfr. I cannot figure out how to make the "buy" call to "price crossed above ema(13) within the past 1 day" , I'm not a coder at all. So I added 1st line. ------------------------------------------------------------------------------------------- price crossed above ema(13) from below within the past 1 day close is between 1 and 10 average volume(90) above 100000 average volume(10) above 500000 Average Volume(30) above 250000 offset is 0 draw IFT(5,9) and draw IFT(5,9) line at 0 and draw IFT(5,9) line at -.90 add column IFT(5,9) IFT(5,9) < 0.80 add column separator set{slope_incr, days(slope IFT(5,9) < slope of IFT(5,9) 1 day ago, 30)} draw slope_incr set{slope_pos, days(slope of IFT(5,9) < 0, 30)} draw slope_pos set{sort, slope_pos + slope_incr} set{volcnt, count(volume above 100000, 100) } set{volzero, count(volume equal 0, 100) } set{x1, high - open} set{Long_Profit, x1/open } set{C1A, count(Long_Profit > .04 , 100)} set{C2A, count(Long_Profit > .09, 100)} set{C0010, C1A - C2A} set{D1A, count(Long_Profit > .09 , 100)} set{D2A, count(Long_Profit > .19, 100)} set{D1020, D1A - D2A} set{E1A, count(Long_Profit > .19 , 100)} set{E2A, count(Long_Profit > .29, 100)} set{E2030, E1A - E2A} set{F1A, count(Long_Profit > .29 , 100)} set{F2A, count(Long_Profit > .39, 100)} set{F3040, F1A - F2A} set{G1A, count(Long_Profit > .39 , 100)} and add column daychg2 and add column C0010 {4_9} and add column D1020 {10_19} and add column E2030 {20_29} and add column F3040 {30_39} and add column G1A {40+} and add column C1A {ttl} and add column average day range(10) {adr10} and add column average day range(30) {adr30} sort column 6 descending add column industry add column sector set{answer, count(ROC(5,1) above 5, 100)} and add column answer add column open-to-close gap add column separator draw WAIT draw SELL draw BUY draw ema(13) draw dma(25,-5) draw ema(50) add column BUY add column SELL add column WAIT add column both{D2/T3} add column both2{TSI6} ADD COLUMN XOVER ADD COLUMN CROSS set{OVER, count(TSI(6,3,3) crossed above 0,1) *1} set{UNDER, count(TSI(6,3,3) crossed below 0,1) * -1} set{both2, OVER + UNDER} set{CROSS, 1 - count(both2 equals 0,1)} CROSS above 0 set{var1, 2 * EMA(9)} set{var2, cema(ema(9),9)} set{DEMA, var1 - var2} set{TEMA, T3(7,1)} set{xUP, count(DEMA crossed above TEMA,1) *1} set{xDOWN, count(DEMA crossed below TEMA,1) * -1} set{both, xUP + xDOWN} set{xOVER, 1 - count(both equals 0,1)} add column separator set{pp_3, CeMA(pp,3) 1 day ago} set{r_3, CeMA(r1,3) 1 day ago} set{s_3, CeMA(s1,3) 1 day ago} set{VAR3, count(close above pp_3,1)} set{VAR4, count(close below r_3,1)} set{WAIT, VAR3 * VAR4} set{BUY, var3 - wait} set{SELL, var4 - wait} draw T3(5,0.7) draw TEMA on plot price draw DEMA on plot price draw TSI(6,3,3) and draw MACD(12,26,9) and draw ADX(14) and draw CCI(14) with horizontal line 0 and draw Williams %R(14) with center line -50 and draw full Stochastic(14,3,3) with horizontal line 50 and draw OBV and draw RSI(15) and draw LRS(20) and draw Bollinger(20,2) and draw Aroon Down(25) and aroon up(25) and draw ROC(10) with center line 0 and draw Average Volume(10) and draw Absolute Volume Oscillator(15,60) and draw VROC(20) and draw CMF(20) and draw VWMACD Histogram(12,26,9) and draw PVO(12,26,9) with center line 0 add column separator /*close position within a 1-month price range*/ set{hi1mo,high 1 month high} set{lo1mo,low 1 month low} set{cllo1mo,close - lo1mo} set{hilo1mo,hi1mo - lo1mo} set{diff1,cllo1mo / hilo1mo} set{%gain1mo,diff1 * 100} /*close position within a 2-month price range*/ set{hi2mo,high 1 month high 1 month ago} set{lo2mo,low 1 month low 1 month ago} set{cllo2mo,close 1 month ago - lo2mo} set{hilo2mo,hi2mo - lo2mo} set{diff2,cllo2mo / hilo2mo} set{%gain2mo,diff2 * 100} /*close position within a 3-month price range*/ set{hi3mo,high 1 month high 2 month ago} set{lo3mo,low 1 month low 2 month ago} set{cllo3mo,close 2 months ago - lo3mo} set{hilo3mo,hi3mo - lo3mo} set{diff3,cllo3mo / hilo3mo} set{%gain3mo,diff3 * 100} /*EMA calc.*/ set{return1,%gain2mo + %gain3mo} set{return2,return1 / 2} set{return3,%gain1mo - return2} set{return4,return3 * 0.6667} set{return,return4 + return2} |
| Mansor 78 posts msg #143788 - Ignore Mansor |
6/14/2018 1:55:59 PM Review ON 6/6/18 after market I had posted INSY with value of 1 for ts/d2overt3/xover. It had met all check marks and was around $7.06, after the post I had decided to buy into it and I didn't cause the value had dropped below $7 & lingered there for few days until today 6/14/18, insy shot up beyond $8. so now, im wrting this post to go back and re-evaluate cause something isn't fitting right..perhaps in my head? I can't seem to understand the mechanics for some reason, each stock after checking all those variables xover/tsi/d2overt3 drops down and around post 7 days surges back.. |
| Mactheriverrat 3,178 posts msg #143791 - Ignore Mactheriverrat |
6/14/2018 7:01:26 PM INSY was trading in a range area of support and resistance. Today it broke resistance on higher volume. Should be up again tomorrow. 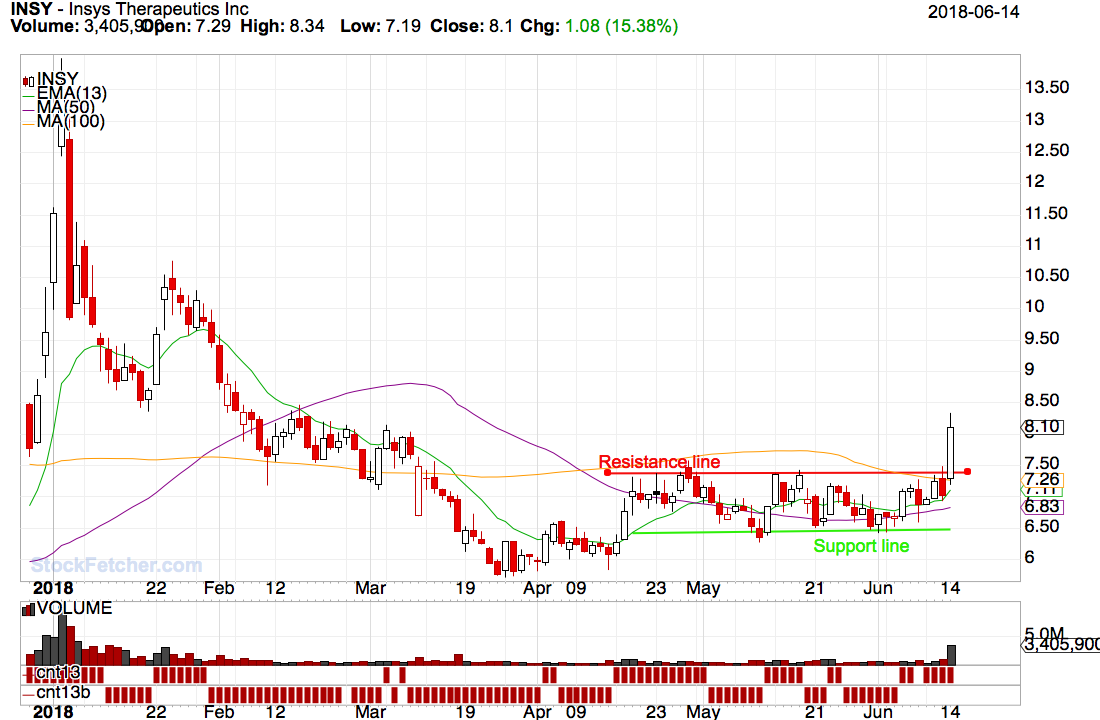 |
| Mactheriverrat 3,178 posts msg #143792 - Ignore Mactheriverrat |
6/14/2018 7:04:37 PM ECYT Bulls and Bears fighting at the resistance line. 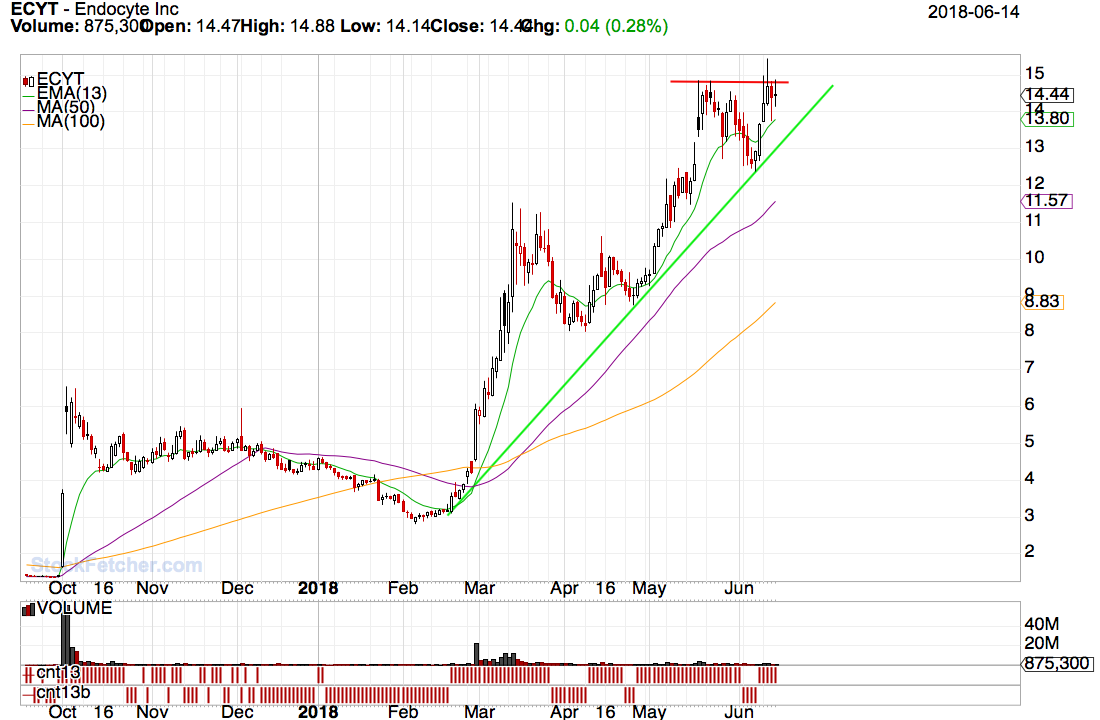 |
| Mansor 78 posts msg #143814 - Ignore Mansor |
6/15/2018 8:54:49 PM MAC thank you for shedding light on R & S. That's something I will def. add to my strategy & as I do my prep over the week to be ready come Monday. I did open ustocktrade acct as well. It's a relief that I won't have to factor in transaction fee into my trade & I can trade as many times as I like, unlike Robinhood (3 trades in a week or so & t+2 for money transfer) Anyway, I'm happy about that. Have a great weekend!! |
| vmittal 13 posts msg #153351 - Ignore vmittal |
8/1/2020 5:50:13 PM Please explain the different colmns what are they? and how to read these columns in relation to picking the stocks for next day? which stock I am selecting to trade next day out of 300 i got so many off scan result? Thanks |
| vmittal 13 posts msg #153352 - Ignore vmittal |
8/1/2020 6:14:02 PM Do you wait for pullback or go long right away if open and close price is of first 5 min bar is higher than yesterday? I need to know . Thanks. |
| risjr 230 posts msg #158996 - Ignore risjr |
4/24/2022 11:13:16 AM So Avery, you are not 2 people? |
| StockFetcher Forums · Filter Exchange · DEADLY COMBO | << 1 ... 17 18 19 20 21 >>Post Follow-up |