StockFetcher Forums · Filter Exchange · Bull Filter<< 1 2 3 >>Post Follow-up
shillllihs
5,963 posts
msg #151531
Ignore shillllihs
modified
3/28/2020 2:40:56 PM

Thanx, I saw the move over 30 but like I said it was late and I noticed it didn't work every time, go back a few months and you will see price continues to drop on a few results. I'm not looking to be a hero, I'm looking for excellent results. It might be the volatility that's making it great right now.
Because of my hedge fund that I run, I'm always looking for high% etf plays, this is good and so are several others on SF. but always trying to improve.

Mansor
78 posts
msg #151819
Ignore Mansor
modified
4/13/2020 2:05:33 PM

Question

Can we add float vol to this? Like "sort column float ascending" & add column that shows float "float vol". Thanks in advance

shillllihs
5,963 posts
msg #151839
Ignore shillllihs
4/16/2020 12:29:27 AM

Fetcher[
Symlist(tmf,jnug,Tqqq,Vixy,brzu,uco,ugaz,uslv,gush)
set{BUYlower,count(close closed above lower Acceleration band(20),1)}
set{SELLmedian,count(close closed below Middle Acceleration Band(20),1)}
set{SELLlower,count(close closed below Lower Acceleration Band(20),1)}
set{SELLupper,count(close closed above upper Acceleration Band(20),1)}
set{BUYmedian1,count(close closed below middle Acceleration band(20),5)}
set{BUYmedian2,count(close closed above middle Acceleration band(20),1)}
set{BUYmedian,BUYmedian1 * BUYmedian2}
BUYlower > -1
SELLmedian > -1
sellupper > -1
selllower > -1
BUYmedian > -1
Draw Acceleration band(20)
]


TITrader
6 posts
msg #157498
Ignore TITrader
9/4/2021 6:08:51 PM

Hey and thank you for sharing. Can you please explain briefly this ETF scan? For example TQQQ has buy lower triggered all the time, but it's grinding the upper band. Trying to figure out and thanks.

shillllihs
5,963 posts
msg #157528
Ignore shillllihs
9/9/2021 11:24:48 AM

Hey, I could explain further but as for now, I will not.

TITrader
6 posts
msg #157548
Ignore TITrader
9/10/2021 8:23:31 PM

Sure. Thanks for your answer.

shillllihs
5,963 posts
msg #157550
Ignore shillllihs
modified
9/11/2021 4:13:30 PM

I was very busy trying to refine a system and didn’t have the time. The system was a rudimentary attempt for an entry/exit strategy. It was to buy on lower line and sell at median after crossing upper band. I have since refined it.

TITrader
6 posts
msg #157576
Ignore TITrader
modified
9/13/2021 7:26:09 PM

No problem and thanks!

Mactheriverrat
3,132 posts
msg #157588
Ignore Mactheriverrat
9/15/2021 7:58:46 PM

I find the Acceleration band(20) very interesting .

Mactheriverrat
3,132 posts
msg #157589
Ignore Mactheriverrat
9/15/2021 9:40:20 PM

REAL had a EMA 5 cross above EMA 13 on 9/14/2021 which is a trigger from Carolyn Boroden
@Fibonacciqueen who says the EMA 5 /13 cross keeps her on the right side of the trade. Acceleration band(20) are moving up and a EMA 13 above the center Acceleration band(20) or 20 day MA.

Got in yesterday at the close because I liked the setup. I'm go to see where this system strategy take's me and it broke the downtrend resistance line.

Thanks to Shilllihs for showing of the Acceleration band(20) .
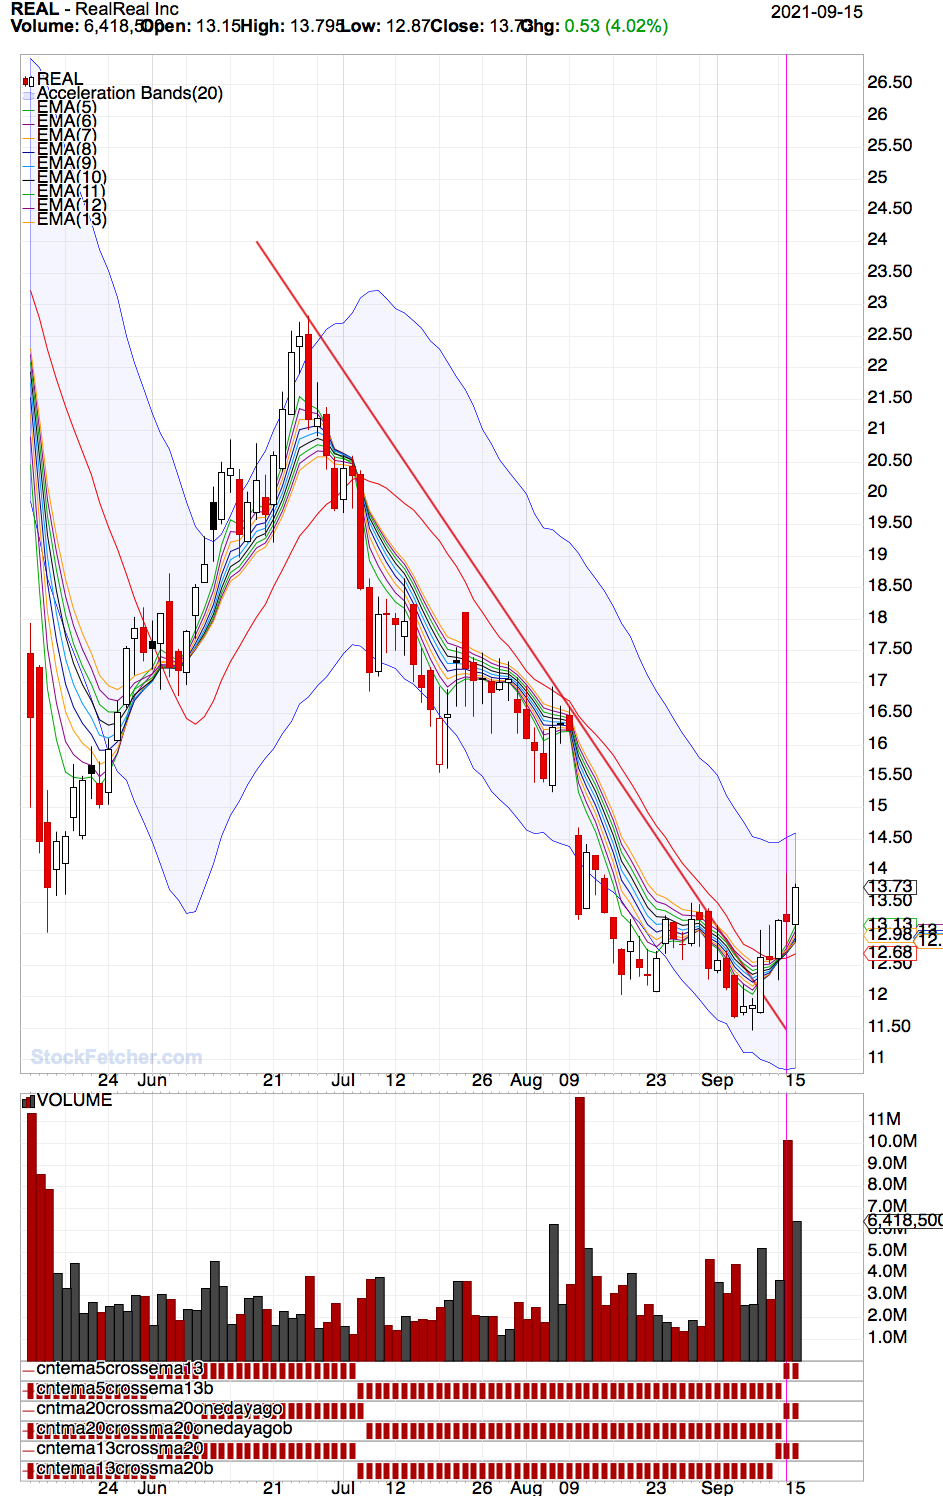


Submit
Fetcher[
Symlist (real)


draw Acceleration band(20)
chart-time is 5 months
add column Average Day Range(30)

/* e513 is number of consecutive days ema(5) above (+)/below(-) previous eMA(13) */
set{e513b,days( ema(5) is above eMA(13) ,250)}
set{e513a,days( ema(5) is below eMA(13) ,250)}
set{e513, e513a - e513b} and add column e513 {e513}

Set{cntema5crossema13,count( ema(5) > ema(13) ,1)}
draw cntema5crossema13

Set{cntema5crossema13b,count( ema(5) < ema(13) ,1)}
draw cntema5crossema13b

/* m20 is number of consecutive days ma(20) above (+)/below(-) previous MA(20) */
set{m20b,days( ma(20) is above MA(20) one day ago,250)}
set{m20a,days( ma(20) is below MA(20) one day ago,250)}
set{m20, m20a - m20b} and add column m20 {m20}

Set{cntma20crossma20onedayago,count( ma(20) > ma(20)one day ago ,1)}
draw cntma20crossma20onedayago

Set{cntma20crossma20onedayagob,count( ma(20) < ma(20) one day ago,1)}

draw cntma20crossma20onedayagob

/* e13m20 is number of consecutive days ema(13) above (+)/below(-) previous MA(20) */
set{e13m20b,days( ema(13) is above MA(20) ,250)}
set{e13m20a,days( ema(13) is below MA(20) ,250)}
set{e13m20, e13m20a - e13m20b} and add column e13m20 {e13m20}

Set{cntema13crossma20,count( ema(13) > ma(20) ,1)}
draw cntema13crossma20

Set{cntema13crossma20b,count( ema(13) < ma(20) ,1)}
draw cntema13crossma20b


draw ema(5)
draw ema(6)
draw ema(7)
draw ema(8)
draw ema(9)
draw ema(10)
draw ema(11)
draw ema(12)
draw ema(13)

Draw rsi(14) line at 70.00
Draw rsi(14) line at 50.00
]


StockFetcher Forums · Filter Exchange · Bull Filter<< 1 2 3 >>Post Follow-up

*** Disclaimer *** StockFetcher.com does not endorse or suggest any of the securities which are returned in any of the searches or filters. They are provided purely for informational and research purposes. StockFetcher.com does not recommend particular securities. StockFetcher.com, Vestyl Software, L.L.C. and involved content providers shall not be liable for any errors or delays in the content, or for any actions taken based on the content.


Copyright 2022 - Vestyl Software L.L.C.Terms of Service | License | Questions or comments? Contact Us
EOD Data sources: DDFPlus & CSI Data Quotes delayed during active market hours. Delay times are at least 15 mins for NASDAQ, 20 mins for NYSE and Amex. Delayed intraday data provided by DDFPlus


This site is protected by reCAPTCHA and the Google Privacy Policy and Terms of Service apply.