| StockFetcher Forums · Filter Exchange · A Better Exit Strategy Is Needed For Swing Systems | << 1 2 >>Post Follow-up |
| Dylan 43 posts msg #156675 - Ignore Dylan |
4/23/2021 11:57:22 AM Here is a system I've been trading successfully for the past 2 yrs. Let me know if you're interested. Perhaps we can share. 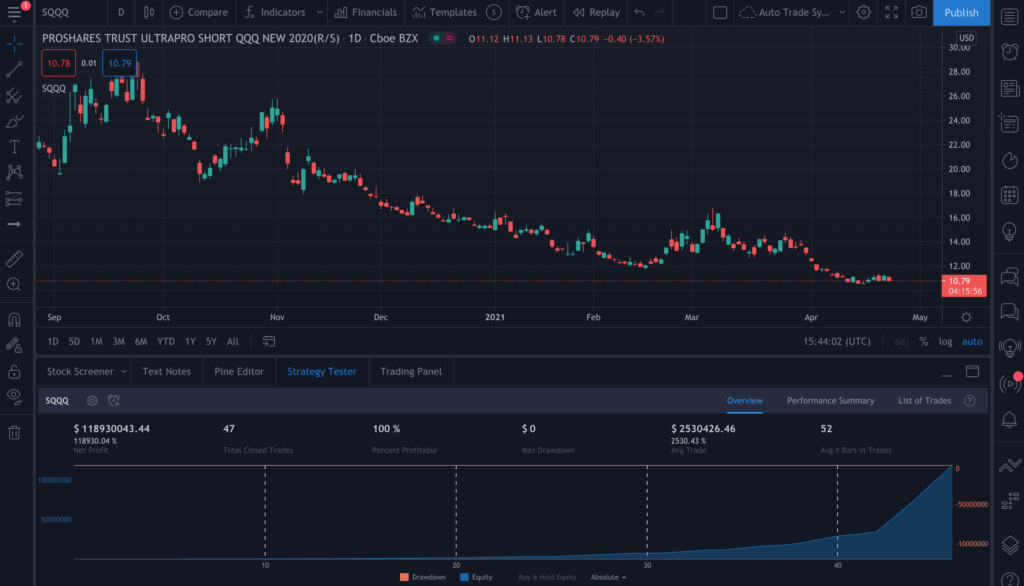 |
| nibor100 1,103 posts msg #156679 - Ignore nibor100 |
4/24/2021 4:59:28 PM The chart posted from TradingView about this profitable system for the past 2 years seems to have a few oddities: 1. No buy or sell arrows on the daily 9 month chart shown. 2. Max Drawdown of $0, to my knowledge this would be the first system ever with no drawdowns, especially considering the average trade duration is 52 bars/days 3. The statistics shown can't possibly be for the last 2 years as 47 completed trades with an average duration of 52 days takes way longer than 2 years unless many of them are simultaneous trades... Ed S. |
| Dylan 43 posts msg #156683 - Ignore Dylan |
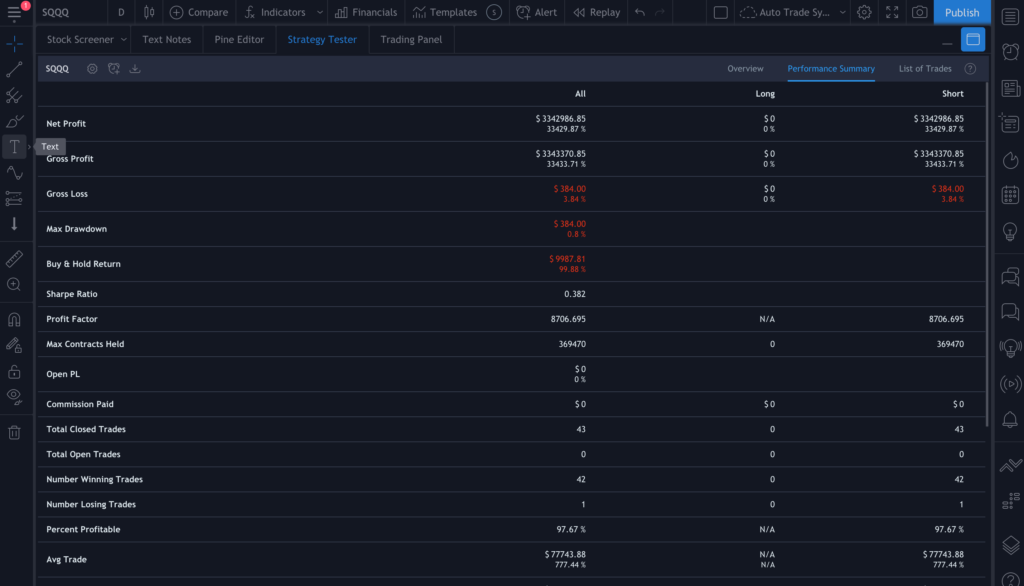
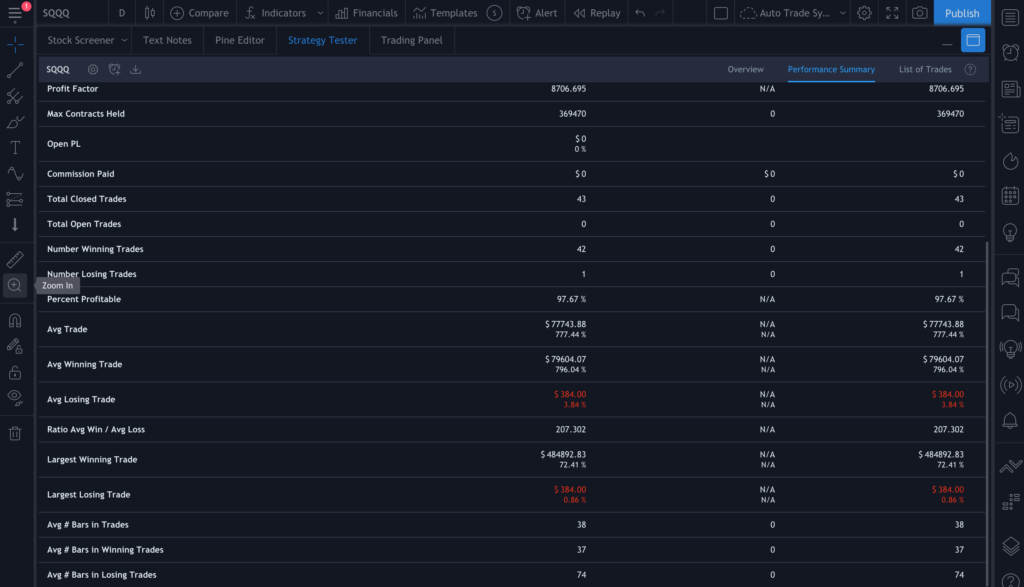
4/25/2021 2:35:45 PM Ed, 1) The buy/sell arrows & indicators can be enabled or disabled. I've now enabled them for you on the chart. 2) Tradingview does not calculate drawdown on systems that are 100% profitable. I've tweaked the parameters to show 97.67% profitable instead of 100% to show you the system drawdown. 3) I've been trading this system for 2 years but the backtest you see goes back to 6/2013. The reason why the drawdown is good is because it averages in a second entry. 2 max open positions. thx 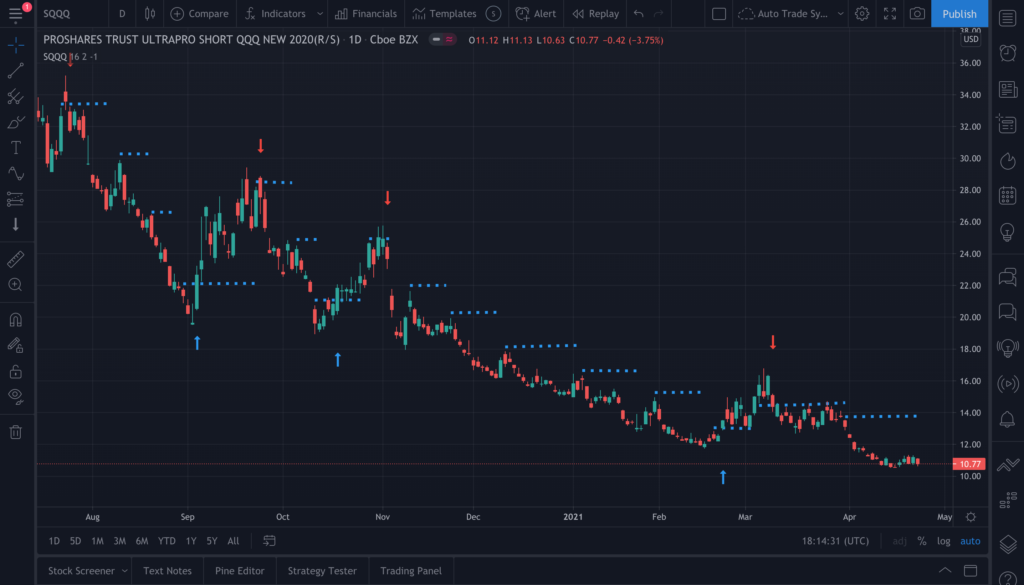
 |
| nibor100 1,103 posts msg #156687 - Ignore nibor100 |
4/26/2021 1:12:32 PM @Dylan, Thanks for the detailed reply, I've only done a couple of backtests with Trading View and did not realize that the Buy and Sell arrows could be toggled off. Nor did I know about the 100% profitable restriction on the calc of Max Drawdowns for backtests ( seems odd though) Ed S. |
| nibor100 1,103 posts msg #156692 - Ignore nibor100 |
4/27/2021 2:21:24 PM I just ran a short backtest, 2 trades, 100% profitable on SQQQ on TradingView and was provided a Max Drawdown calculation in the Overview section, so apparently its not always set to 0. Ed S. |
| Dylan 43 posts msg #156696 - Ignore Dylan |
4/27/2021 6:08:03 PM Ed, here is a completely different strategy that you can try & see it for yourself. System drawdown is also set to 0. 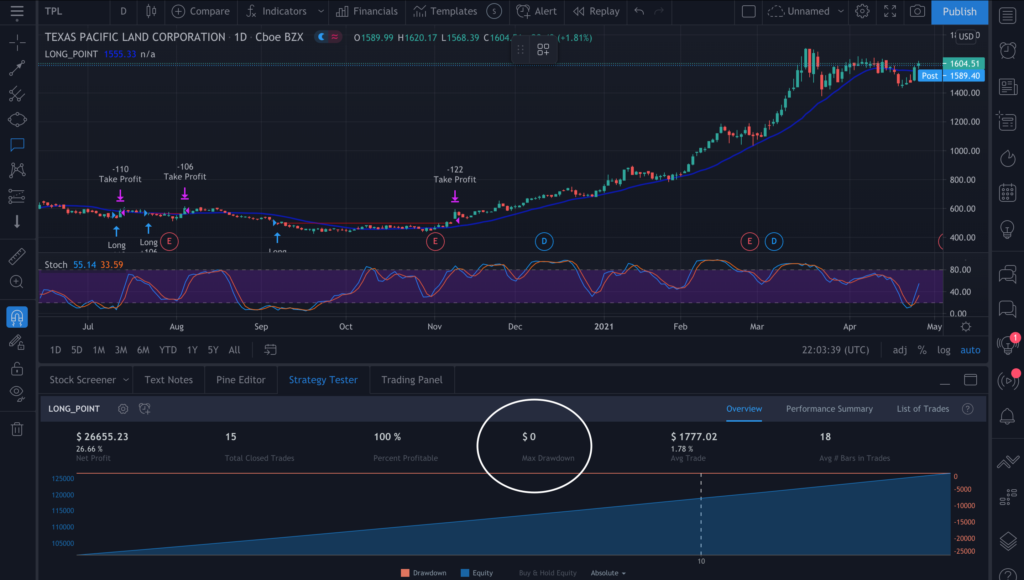 |
| nibor100 1,103 posts msg #156722 - Ignore nibor100 |
5/2/2021 10:08:39 AM Well it took me a while to get the right settings in Tradingview, for this "Long Point 100% Profitable" protected script, for the individual stock TPL,to match Dylan's chart. For those that are interested, once you have the Long Point on screen and the stock set to TPL in TradingView, and the chart displaly to Daily, click on the Long Point text line and choose the settings symbol and change the dates to 6/1/2018 and 4/15/2021 under the Inputs tab, and in the Properties tab change the pyramiding to 1. When I click on the Maximize symbol at the bottom right corner below the chart I get a display with 3 tabs, Overview which shows the data that Dylan had open on his chart display with the Max Drawdown of $0. Best as I can determine, TradingView calculates their Max Drawdown based on completed trades effect on Total Equity, so in 100% profitable trades situation, the total equity goes up after every profitable trade so there is no Max Drawdown to calculate. (seems kind of useless to me) When I select the "List of Trades" tab the display shows a drawdown column, showing a drawdown calculation for each individual trade. Of note is the drawdown for trade #12 of -53%, which I initially thought was the % drop in total equity due to that trade, but it actually is the % of loss $ in terms of the $ used to initiate that single trade.(at least with the associated $ drawdown loss value we can derive normal Max Drawdown values if we choose, which in this case would be -25%) By the way, the List of Trades data is downloadable for use in Excel, etc. It appears to me that the strength of this strategy is by pyramiding at a 20 level when using 15 minute charts. However, since the code is protected in TradingView no way to right a corresponding script in SF unless one of you can reverse engineer the charts to determine indicator useage. Ed S. |
| StockFetcher Forums · Filter Exchange · A Better Exit Strategy Is Needed For Swing Systems | << 1 2 >>Post Follow-up |