| StockFetcher Forums · Filter Exchange · Bollinger %B(5,2.0) cross above 0.2 line | << 1 2 >>Post Follow-up |
| Mactheriverrat 3,152 posts msg #161248 - Ignore Mactheriverrat |
7/19/2024 12:00:20 AM Don't know where I came across it . It's not perfect or is it the Holy grail but I've had some luck with it. If I come across where I found it I will post it here. ----------------------------------------------------------- draw Bollinger %B(5,2.0) line at 0.2 /* B%5 is number of consecutive days Bollinger %B(5,2.0) above (+)/below(-) previous 0.2 *// set{b%5b,days( Bollinger %B(5,2.0) is above 0.2 ,250)} set{b%5a,days( Bollinger %B(5,2.0) is below 0.2 ,250)} set{b%5, b%5a - b%5b} and add column b%5 {b%5} do not Draw b%5 add column b%5 one day ago Set{cntb%5,count( Bollinger %B(5,2.0) > 0.2 ,1)} draw cntb%5 Set{cntb%5b,count( Bollinger %B(5,2.0) < 0.2 ,1)} draw cntb%5b |
| SAFeTRADE 641 posts msg #161249 - Ignore SAFeTRADE |
7/19/2024 1:12:50 PM I like this Mac will hang on to it! |
| Mactheriverrat 3,152 posts msg #161252 - Ignore Mactheriverrat modified |
7/21/2024 5:27:26 PM It's the 3rd strategy in this video. The Bollinger %B(5,2.0) cross of the 0.2 line. Bollinger %b strategy |
| Mactheriverrat 3,152 posts msg #161253 - Ignore Mactheriverrat |
7/21/2024 6:44:38 PM SPY's bollinger %b 5,2 has been below the 0.2 line for 2 days now with a little upward movement Friday. Suggests Monday that the SPY might make a pop up. But like with all indicators that nothing is full proof. Guess Monday will show us. 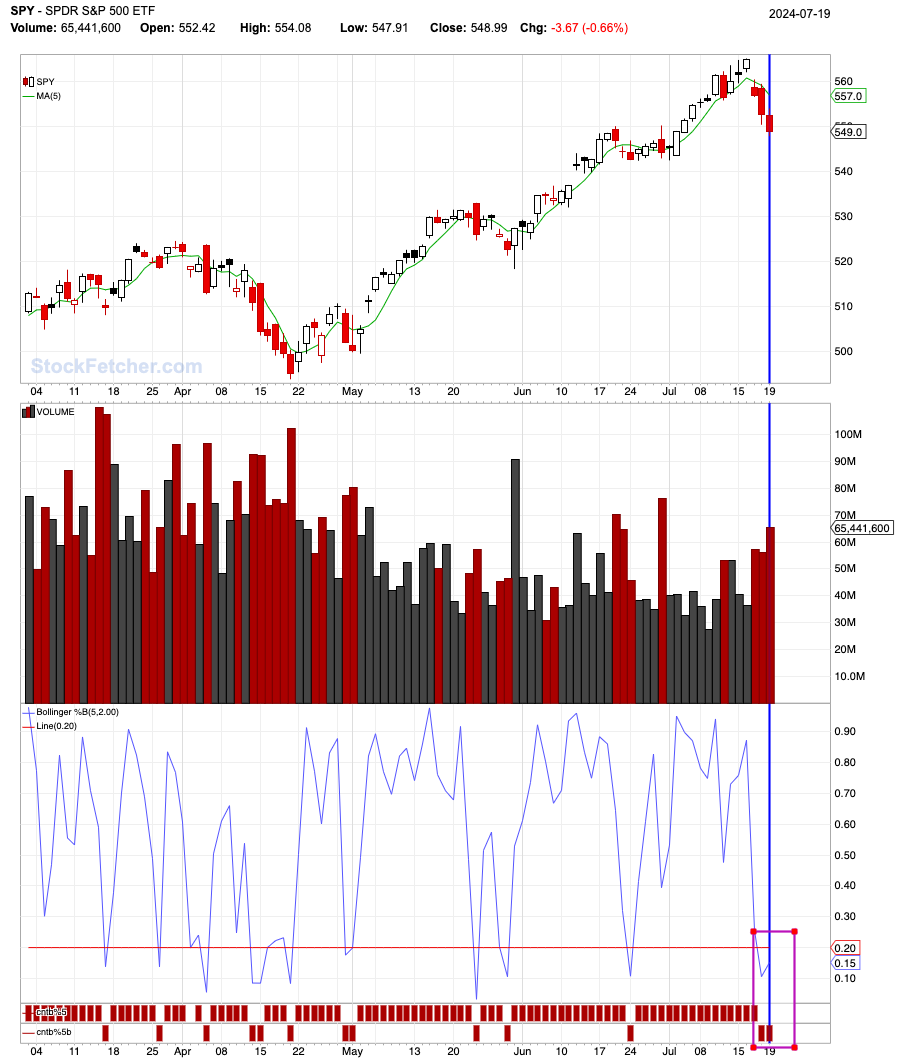 |
| snappyfrog 711 posts msg #161254 - Ignore snappyfrog |
7/22/2024 8:36:34 AM You are getting that pop up in pre-market. |
| snappyfrog 711 posts msg #161255 - Ignore snappyfrog |
7/22/2024 10:47:27 PM John, I am not a big fan of BB, but I find this interesting. I have added my 5 day low along with your filter. It looks like it could give me some insight on some of my possible entries. I will have to look at it after market open to see what it is telling me at that time. Or possibly like the chart of SPY above, it could give me more confidence on getting into a weaker open than I typically like. Thanks! |
| Mactheriverrat 3,152 posts msg #161256 - Ignore Mactheriverrat modified |
7/22/2024 11:05:14 PM Roger that on the your 5 day low filter as I use that on my filters also. I came across that Bollinger %B(5,2.0) indicator video along with your 5 day low filter. You might add line at 0.2 on draw your draw Bollinger %B(5,2.0) draw Bollinger %B(5,2.0) line at 0.2 After todays close. SPY 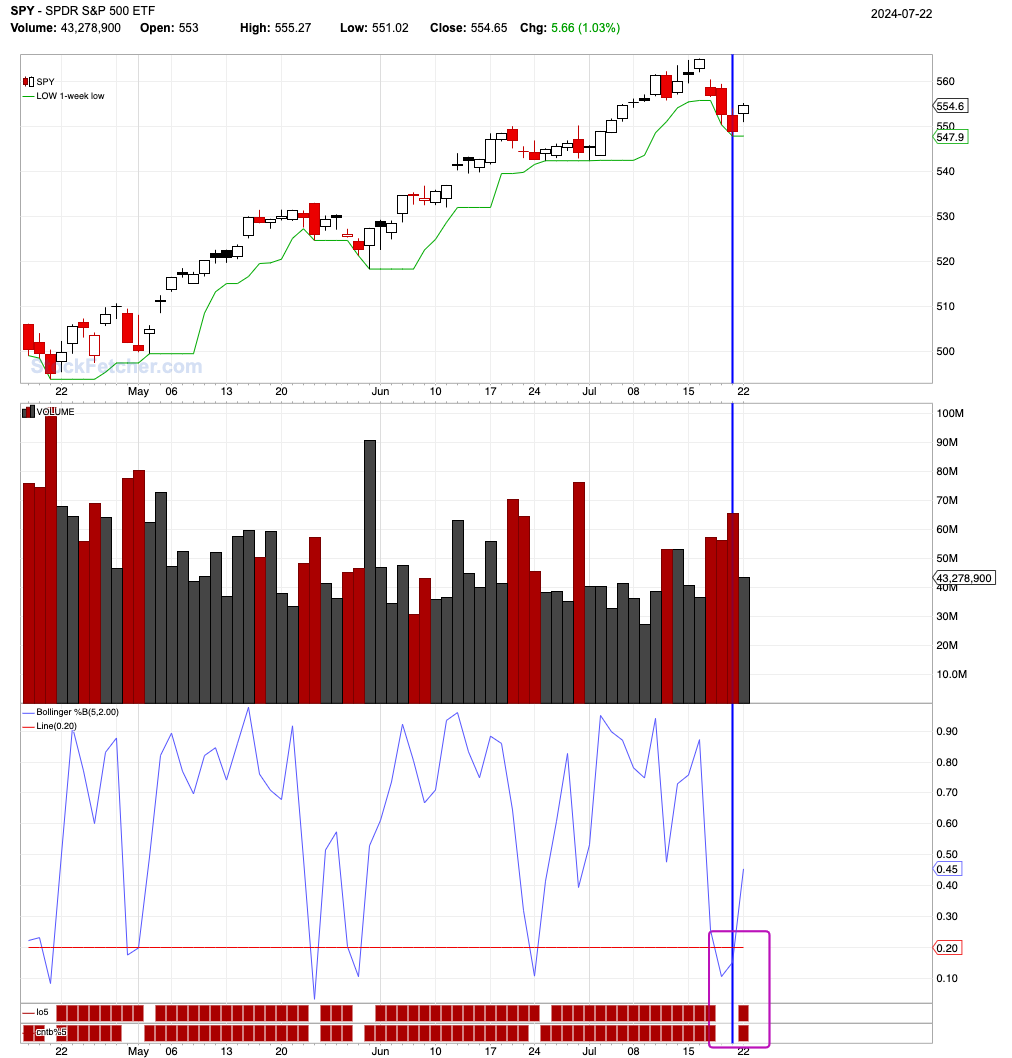 |
| Mactheriverrat 3,152 posts msg #161257 - Ignore Mactheriverrat |
7/22/2024 11:34:11 PM Seems TQQQ had the same effect today as SPY . Seems the Bollinger%b 5,2 give a precusor to trend. I'm not painting it to be a holy grail but I think it has some possibilities . 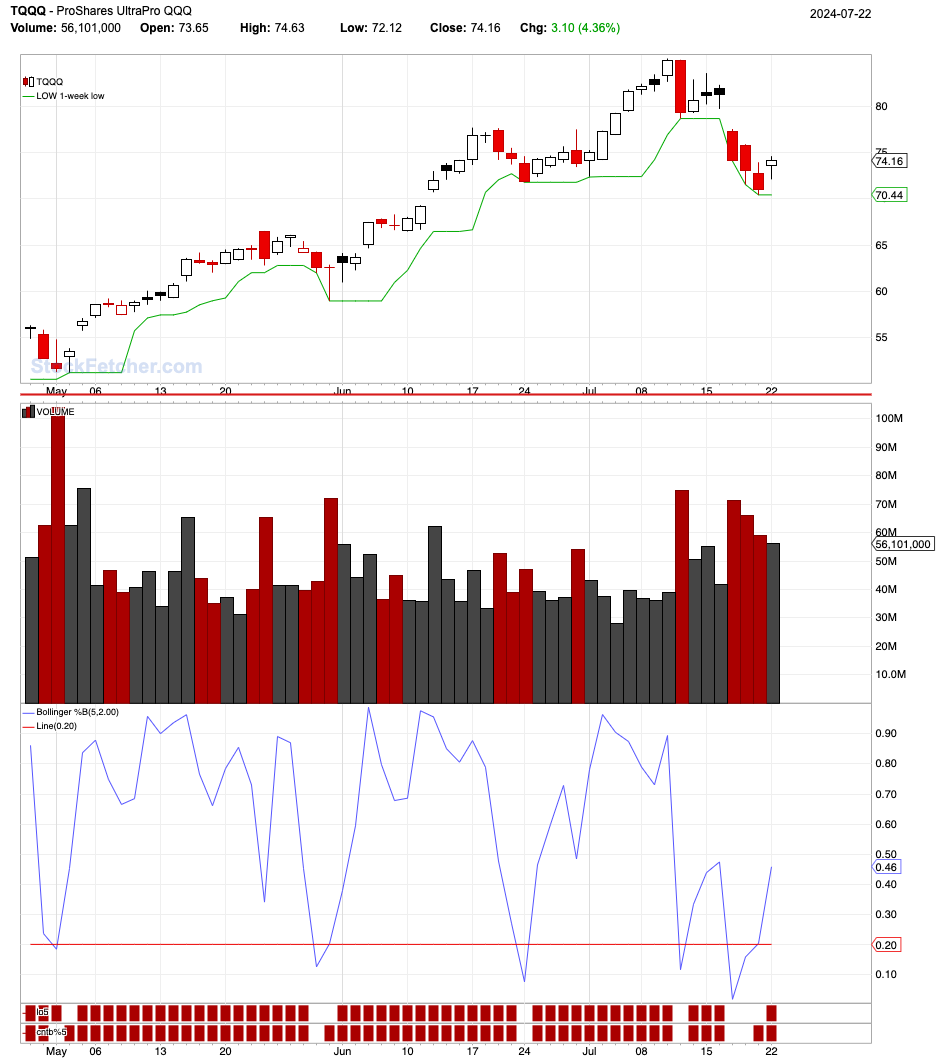 |
| snappyfrog 711 posts msg #161259 - Ignore snappyfrog |
7/23/2024 6:55:47 AM Updated to draw the line. |
| snappyfrog 711 posts msg #161260 - Ignore snappyfrog |
7/23/2024 7:04:30 AM May 31st yours picked MSFT. That was a 5 day low for me. The next trading day, I got a signal on the 5 day low scan. My entry, by my rules, would have been June 4th. However; open was below the previous close, not above as my rules state. Therefore; I would never have gotten into this good run. 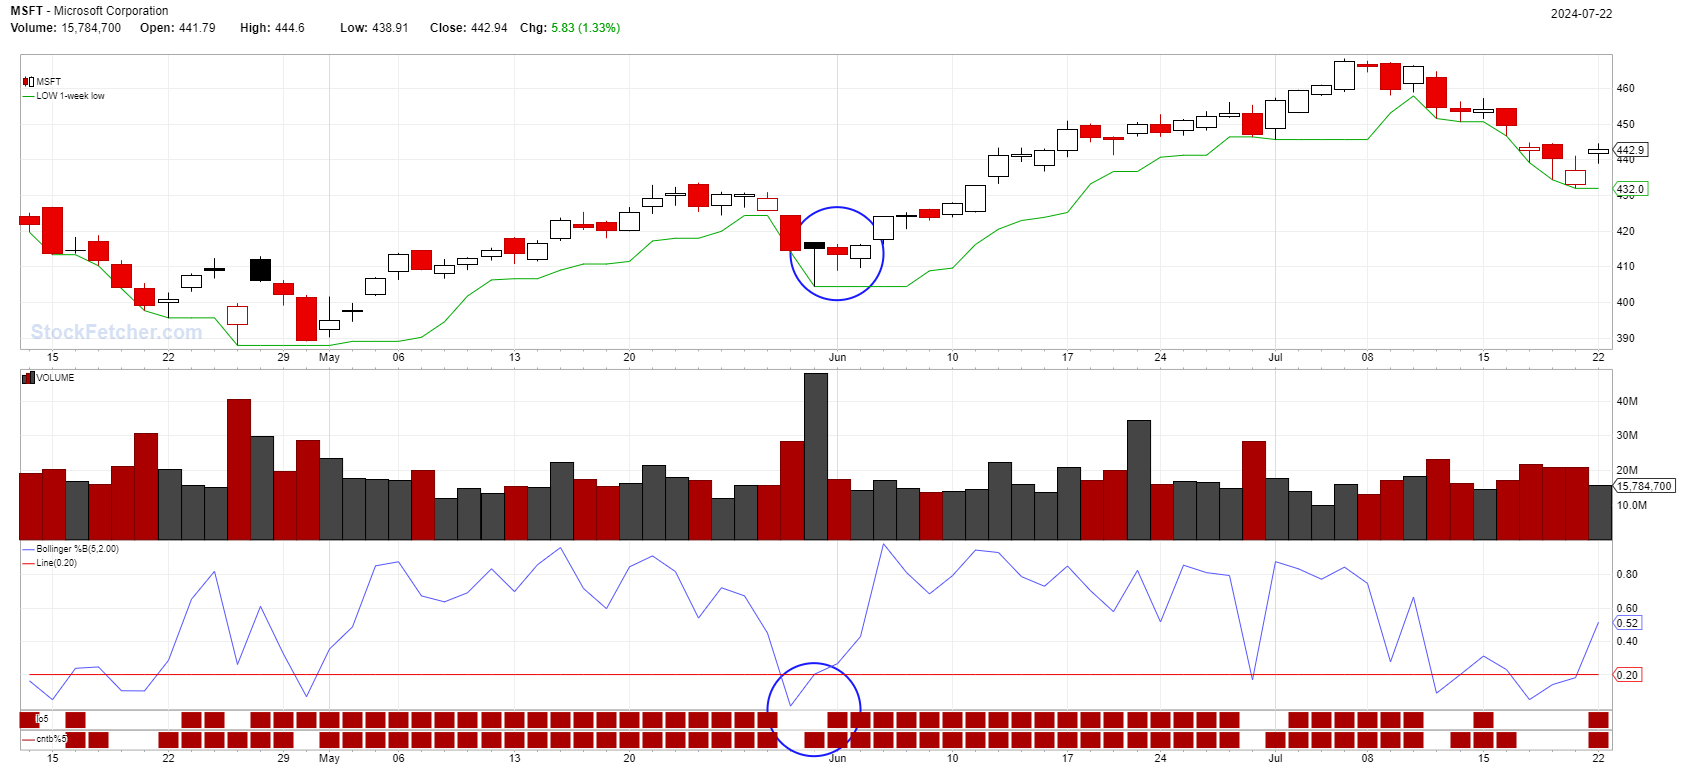 |
| StockFetcher Forums · Filter Exchange · Bollinger %B(5,2.0) cross above 0.2 line | << 1 2 >>Post Follow-up |