| StockFetcher Forums · Stock Picks and Trading · Short HOME | << 1 2 >>Post Follow-up |
| Mactheriverrat 3,178 posts msg #153951 - Ignore Mactheriverrat |
9/6/2020 7:03:01 PM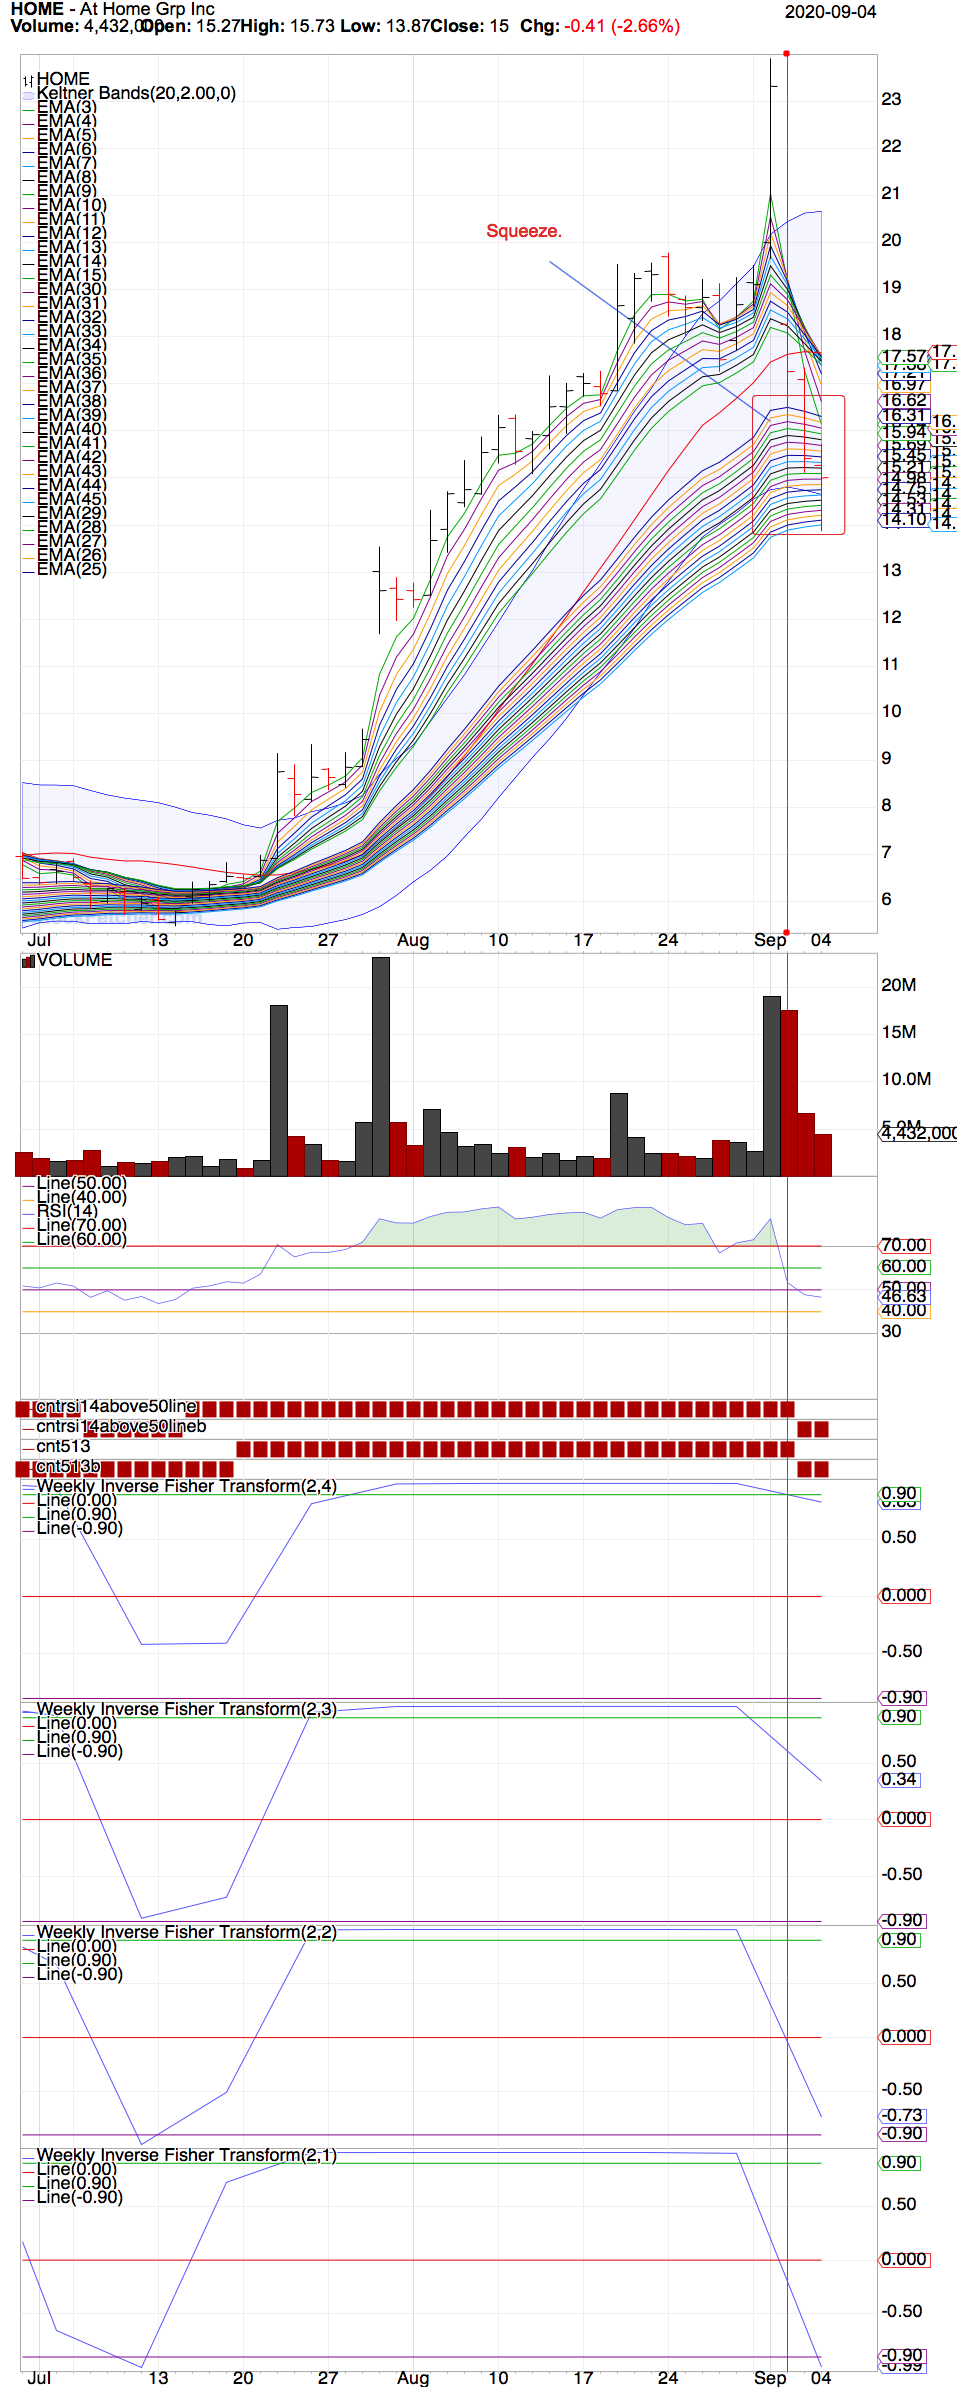 |
| Cheese 1,374 posts msg #153953 - Ignore Cheese |
9/6/2020 7:42:24 PM Mac, Thank you for sharing your new filter. Would you then be waiting for all 3 things before considering going ong? Weekly IFT 2,1 climbing above 0 RSI 14 climbing Guppy ema 5 above ema 13 |
| Mactheriverrat 3,178 posts msg #153954 - Ignore Mactheriverrat |
9/6/2020 9:41:44 PM Its a combination. The add column weekly fit(2,4) where it goes from 1.00 below 1.00 that happened from home on 9/2/20. EMA(25) has made a bend downward but not really rolled over. RSI(14) is getting weaker. All Weekly it's are showing downward movement . This using of weekly of IFT of daily charts has me studying as past posters say you might get false reading and even on the add column weekly IFT(2,4). It may just be a SF perked indicator that only SF can produce. |
| Mactheriverrat 3,178 posts msg #153955 - Ignore Mactheriverrat modified |
9/6/2020 9:56:29 PM Look at OSTK 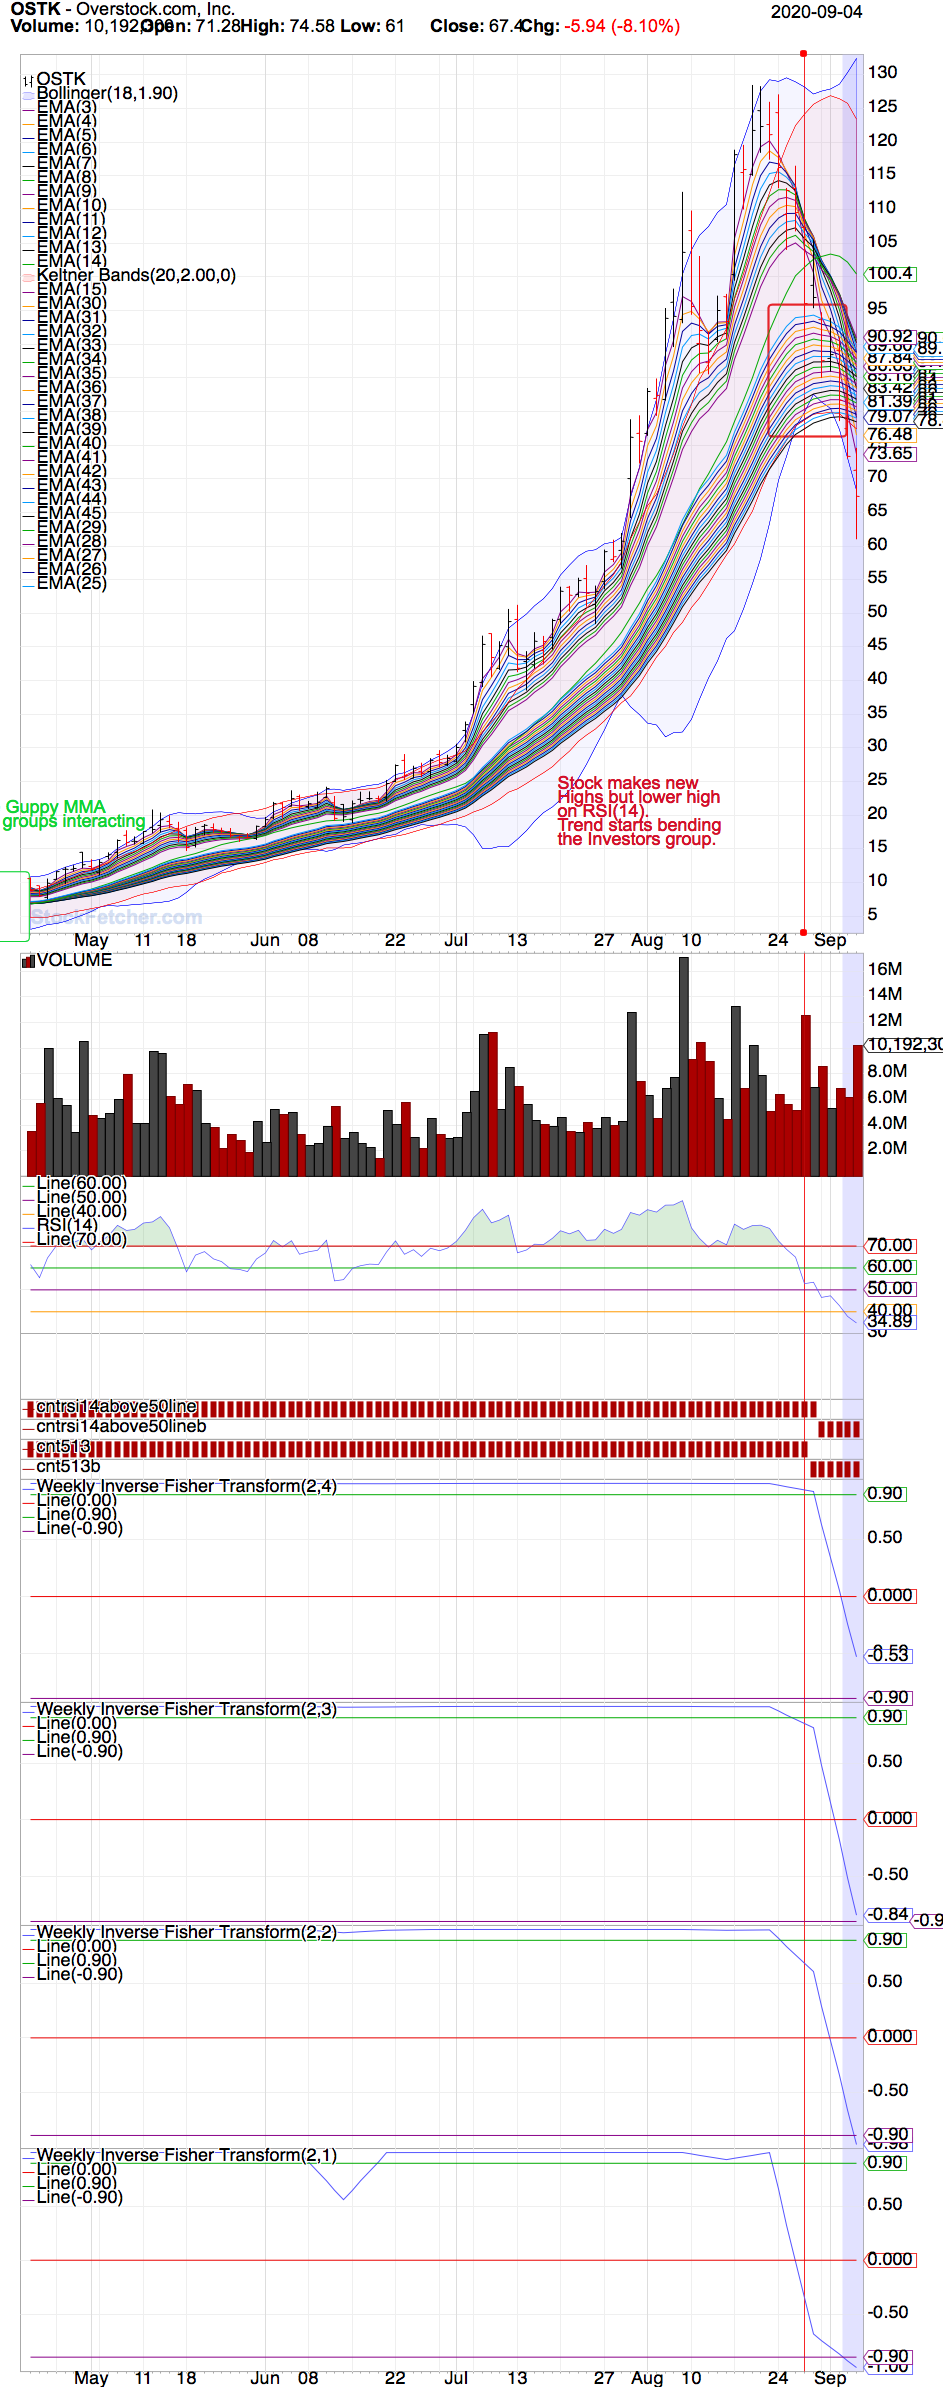 ARNC with both keltner and bollinger bands. Looks like ARNC has what is called a rattlesnake setup where bollinger band squeeze inside kiltner bands. On 9/3/20 it had on the column IFT(2,4) a rollover below 1.00 IMHO I think ARNC is going to drop like a turd going down the toilet if the rest of the market takes a dump. 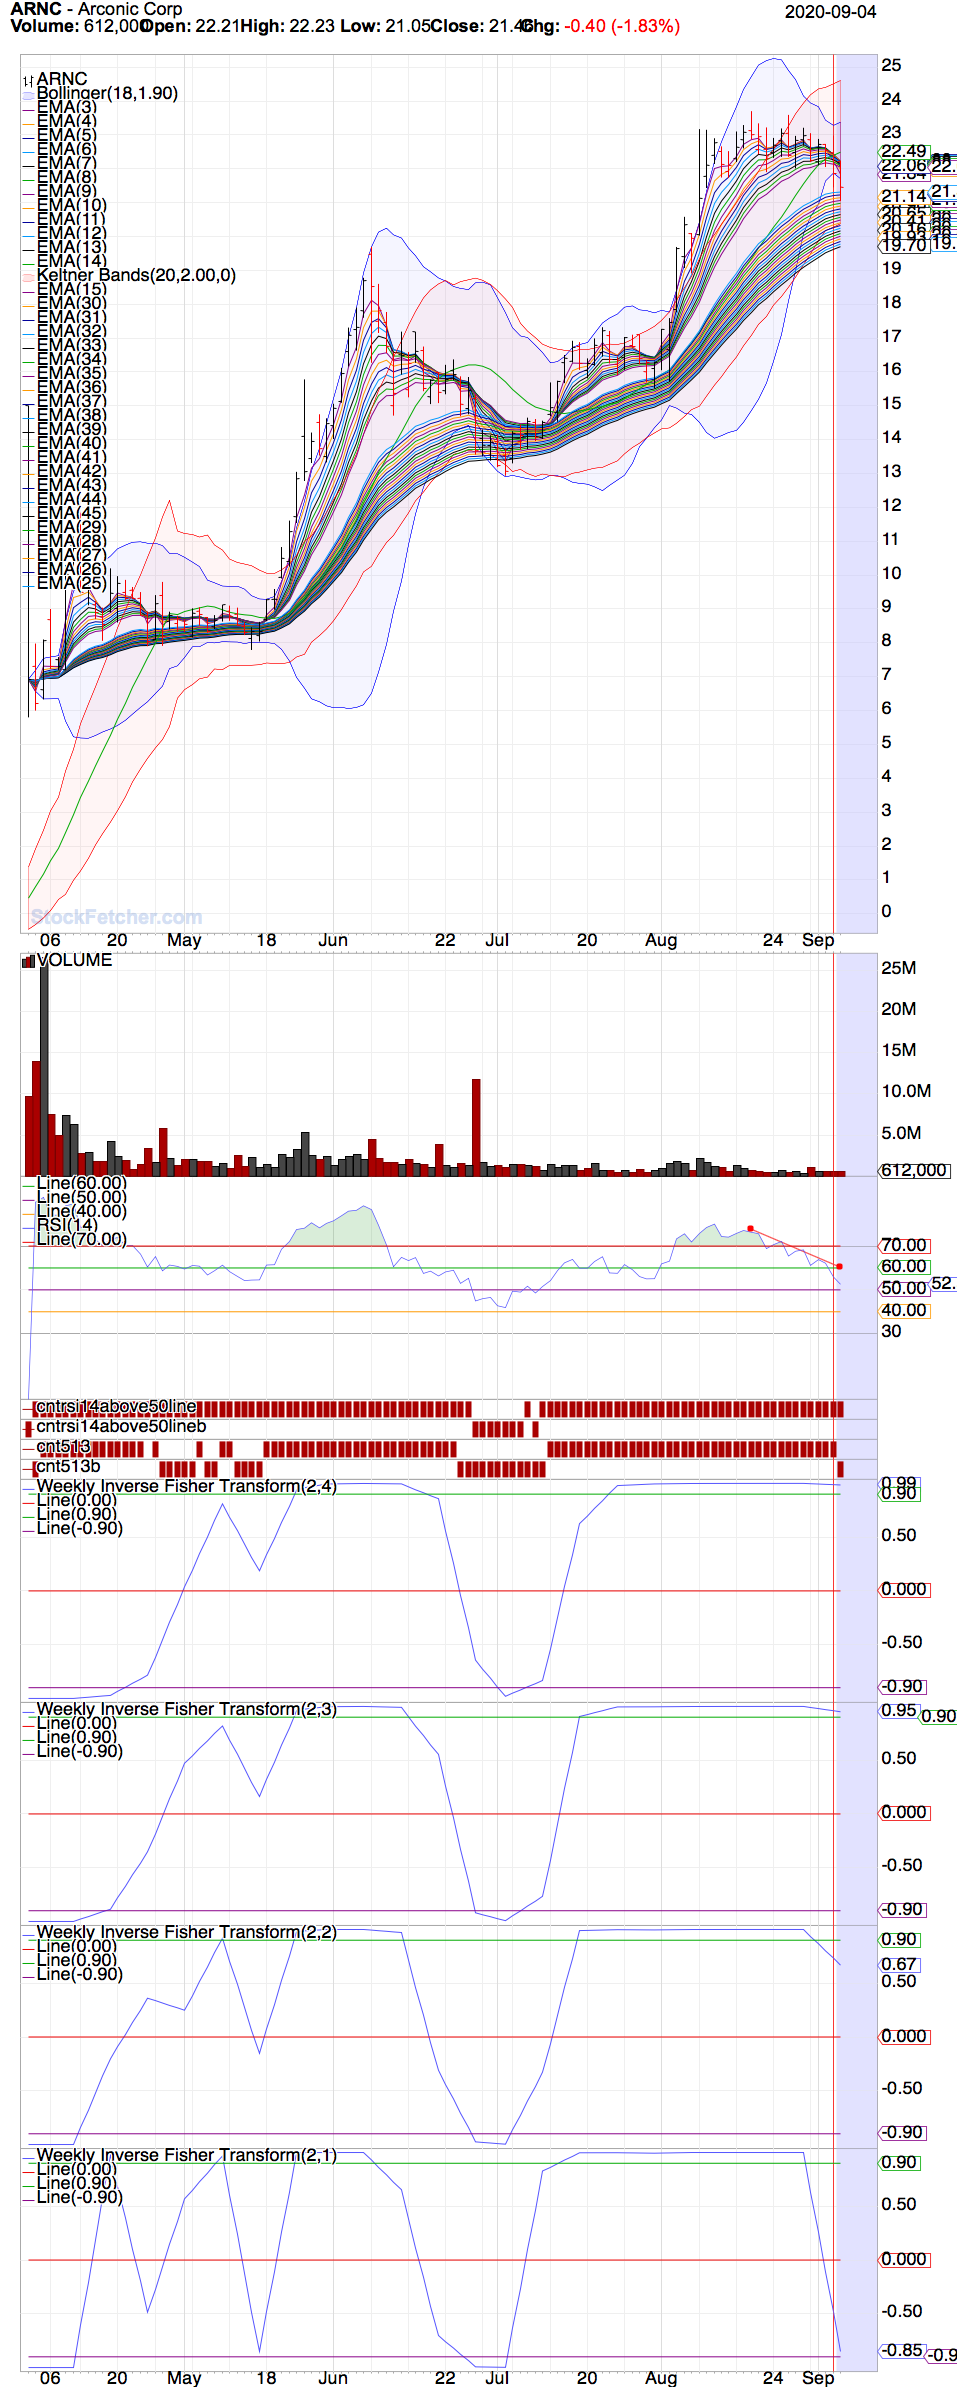 PRTS some thing but it never did ever rollover on the column side from 1.00. It only got up to 0.98. 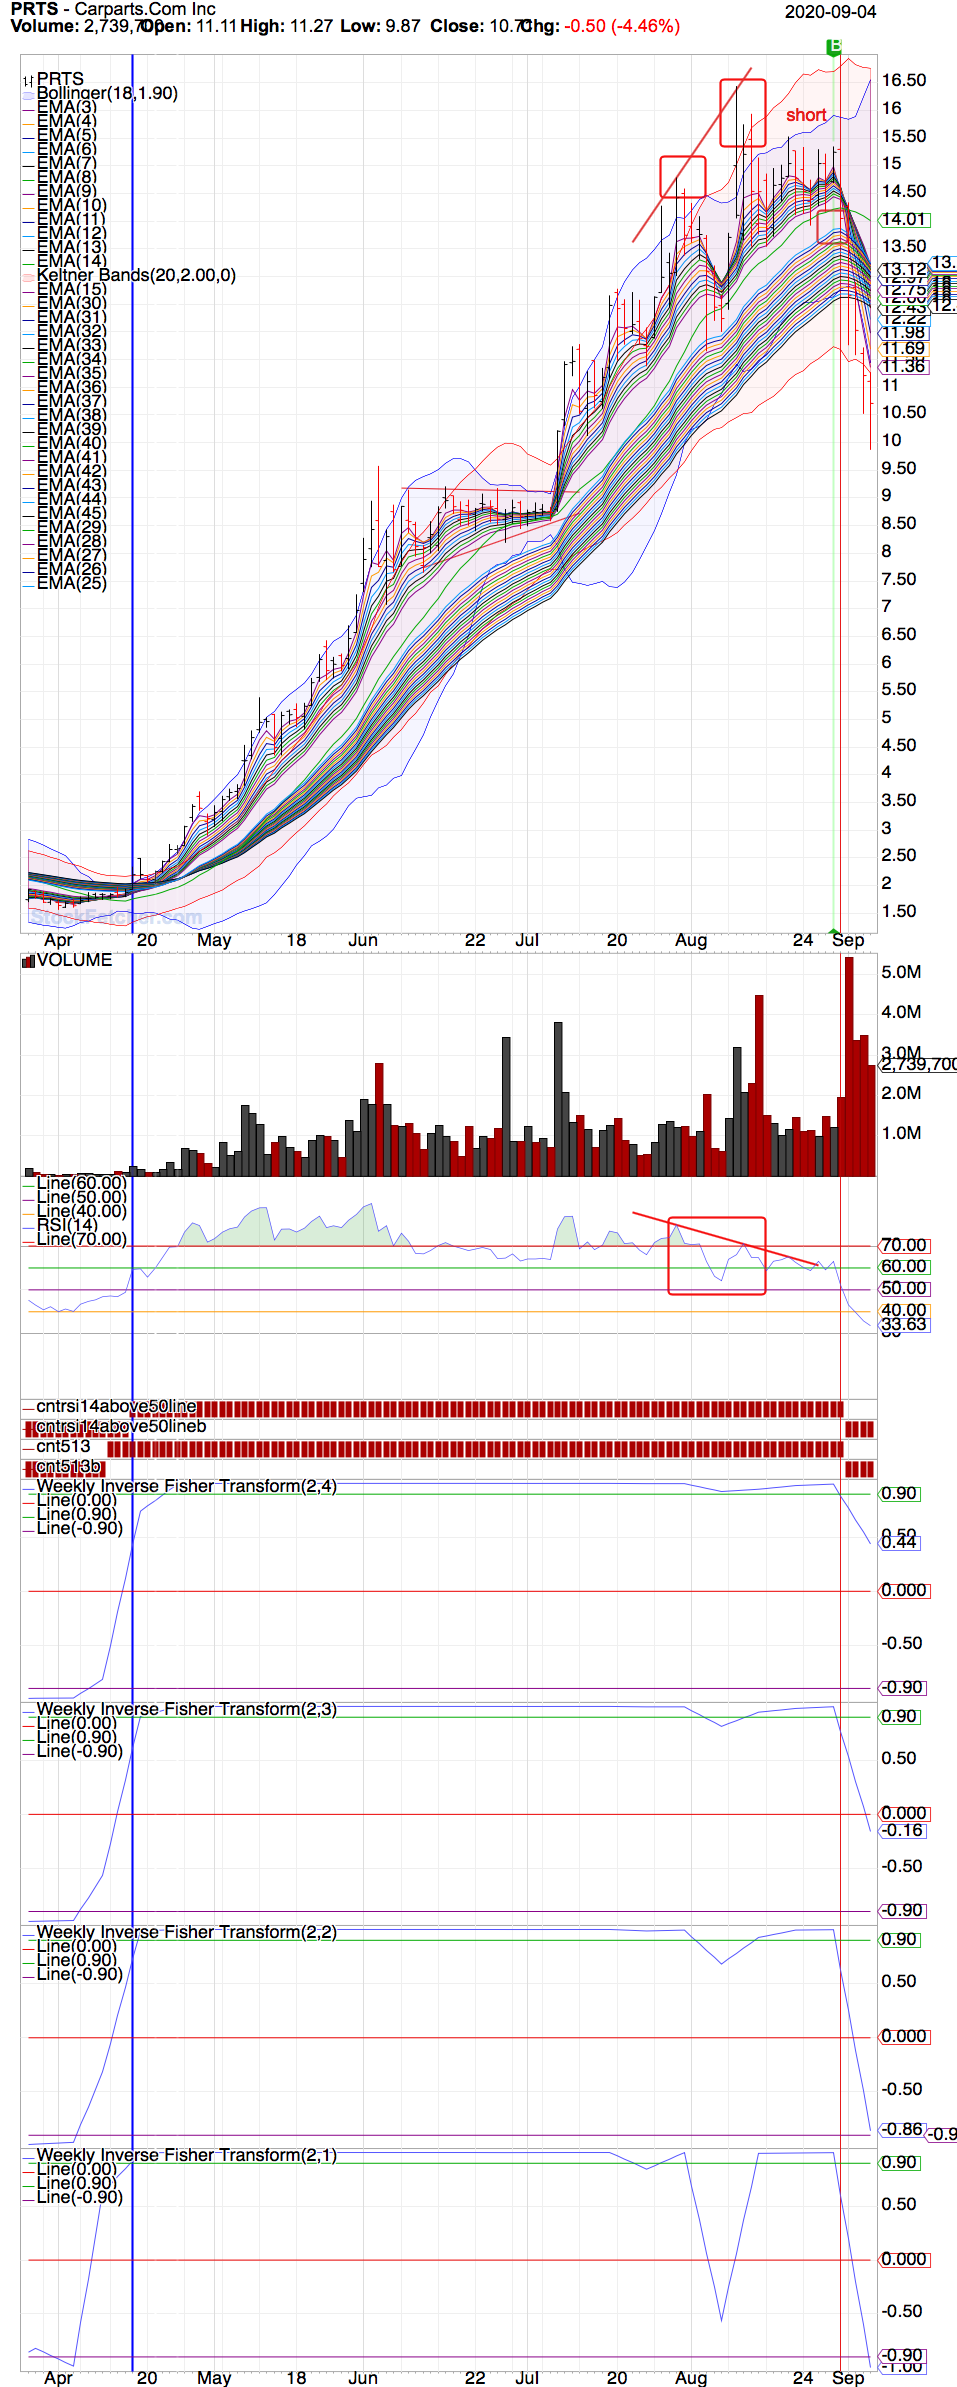 On side note this all happens before the RSI(14) drops below 50.00 and the Ema(5) cross below ema(13). |
| Mactheriverrat 3,178 posts msg #153957 - Ignore Mactheriverrat |
9/6/2020 10:35:13 PM all this is from using weekly IFT(2,4) on daily charts Haven't done any studying of what it might look like using it on weekly charts or even how it would act catching a new uptrend. Like Shillllihs said he's doesn't think we will have one of those big drops but I agree that we are over due for a profit taking pull back of some kind. I'll be watching the Guppy MMA's for that trend. I have noticed that a lot of runners from ANGI to a bunch that are showing the same setup. ANGI 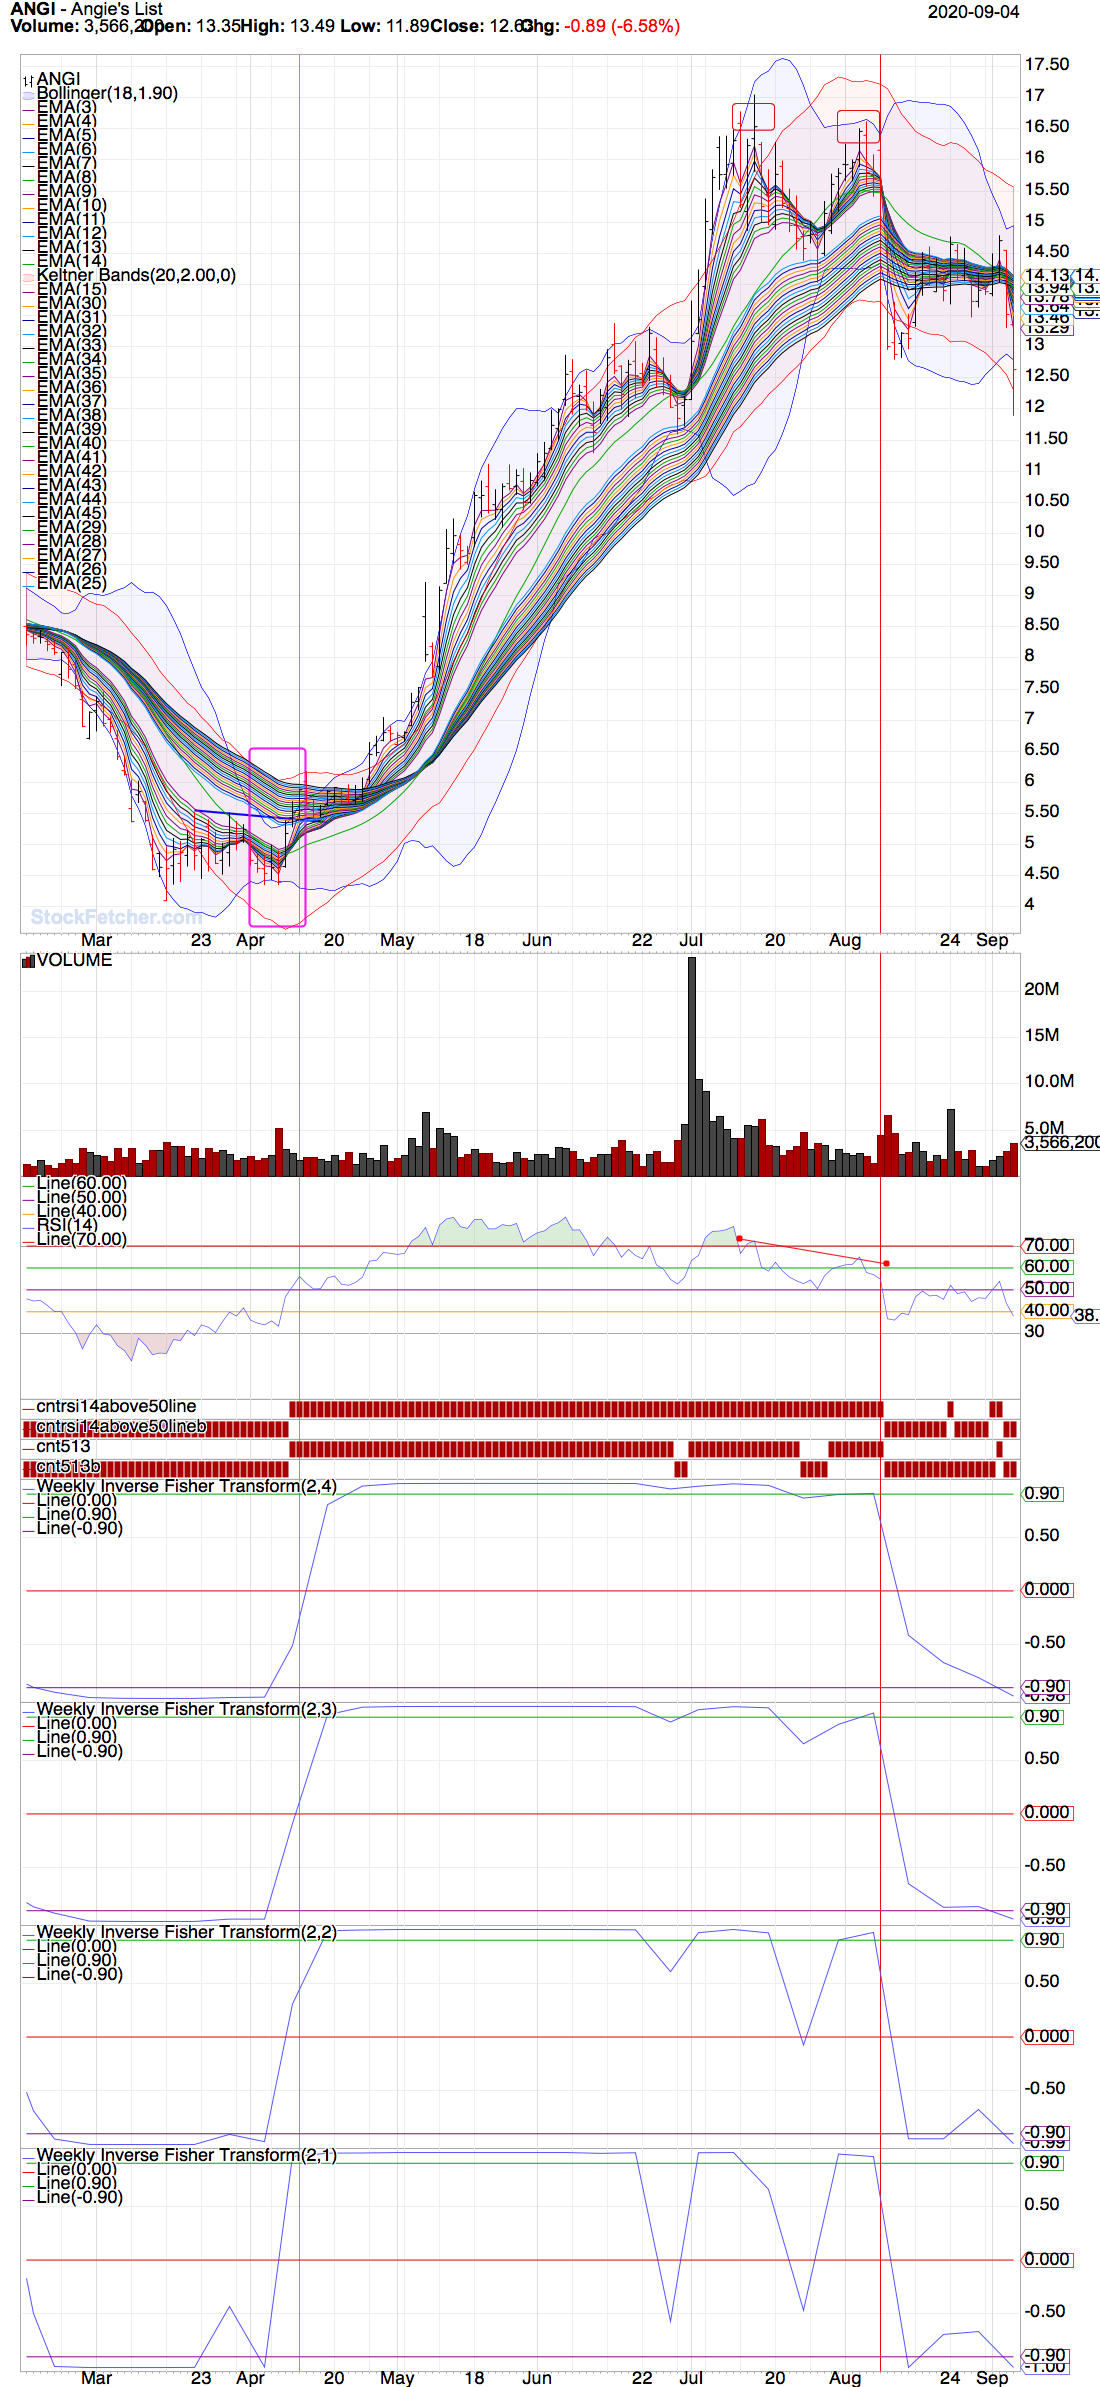 |
| shillllihs 6,102 posts msg #153965 - Ignore shillllihs modified |
9/7/2020 12:23:02 PM Mac, I’m not sure but are weekly Indicators like DMA where signal changes daily until the full week is complete? It may be so look into that. Results always look better with weekly but you may be looking at it after the fact. |
| graftonian 1,089 posts msg #153966 - Ignore graftonian modified |
9/7/2020 12:34:28 PM Mac, I have added the Aroon up/down to the Hull MA cross and Schaff trend cycle. Seems to work fairly well in todays market. That said, with a Aroon downward cross, HOME looks like a short set-up. |
| Mactheriverrat 3,178 posts msg #153967 - Ignore Mactheriverrat |
9/7/2020 2:34:56 PM That may be using Weekly stuff on daily charts. But the Weekly IFT(2,4) does show on the chart when it crosss like say from 1.00 to 98. Guess I will have to look into weekly's. Right now I'm shorting SPWH using the IFT(2,4) and Guppy MMA's 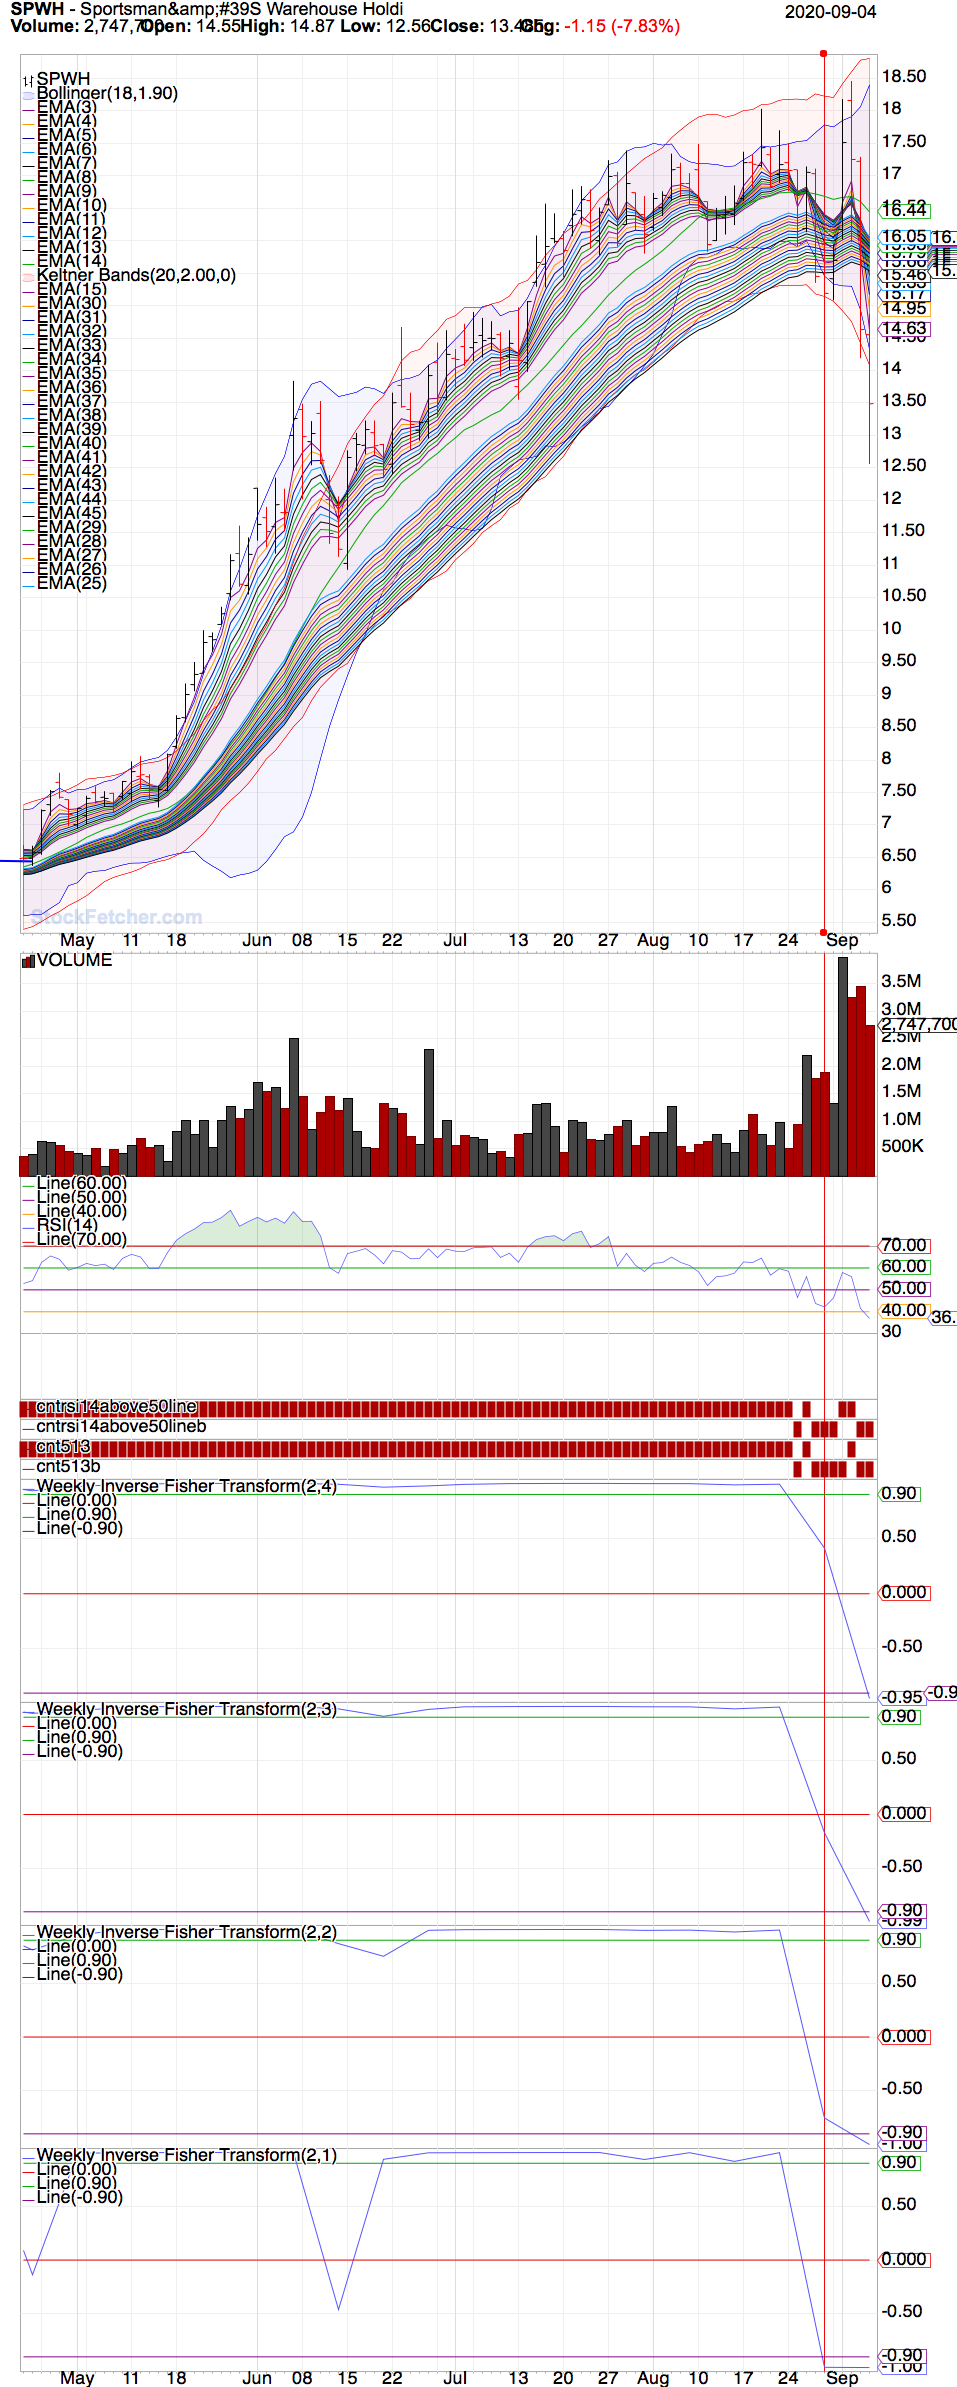 Weekly chart  and ARNC will be on watch. |
| Mactheriverrat 3,178 posts msg #153983 - Ignore Mactheriverrat |
9/8/2020 11:39:22 PM HOME 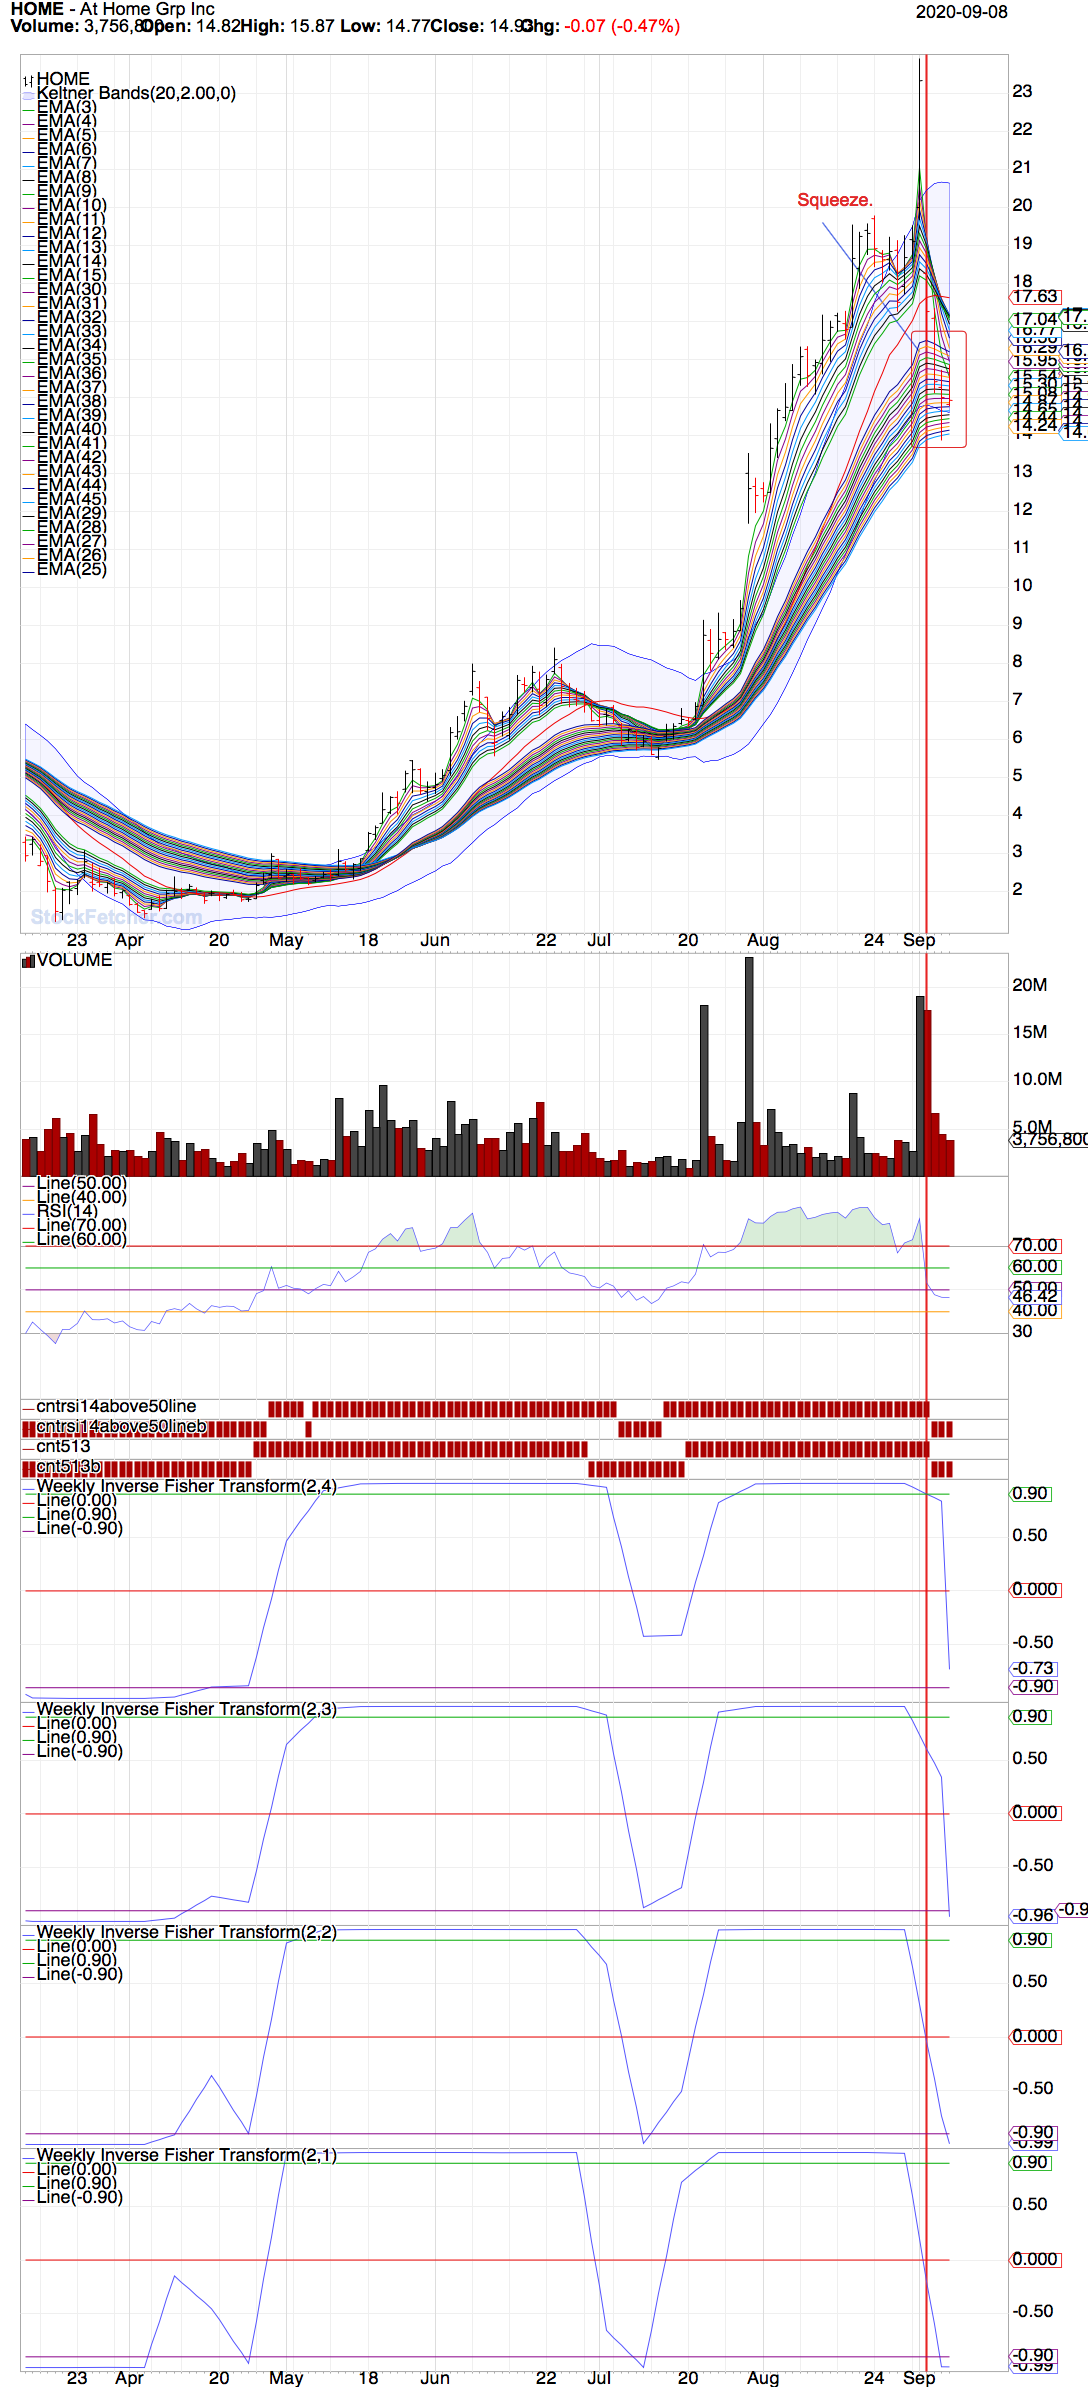 SPWH 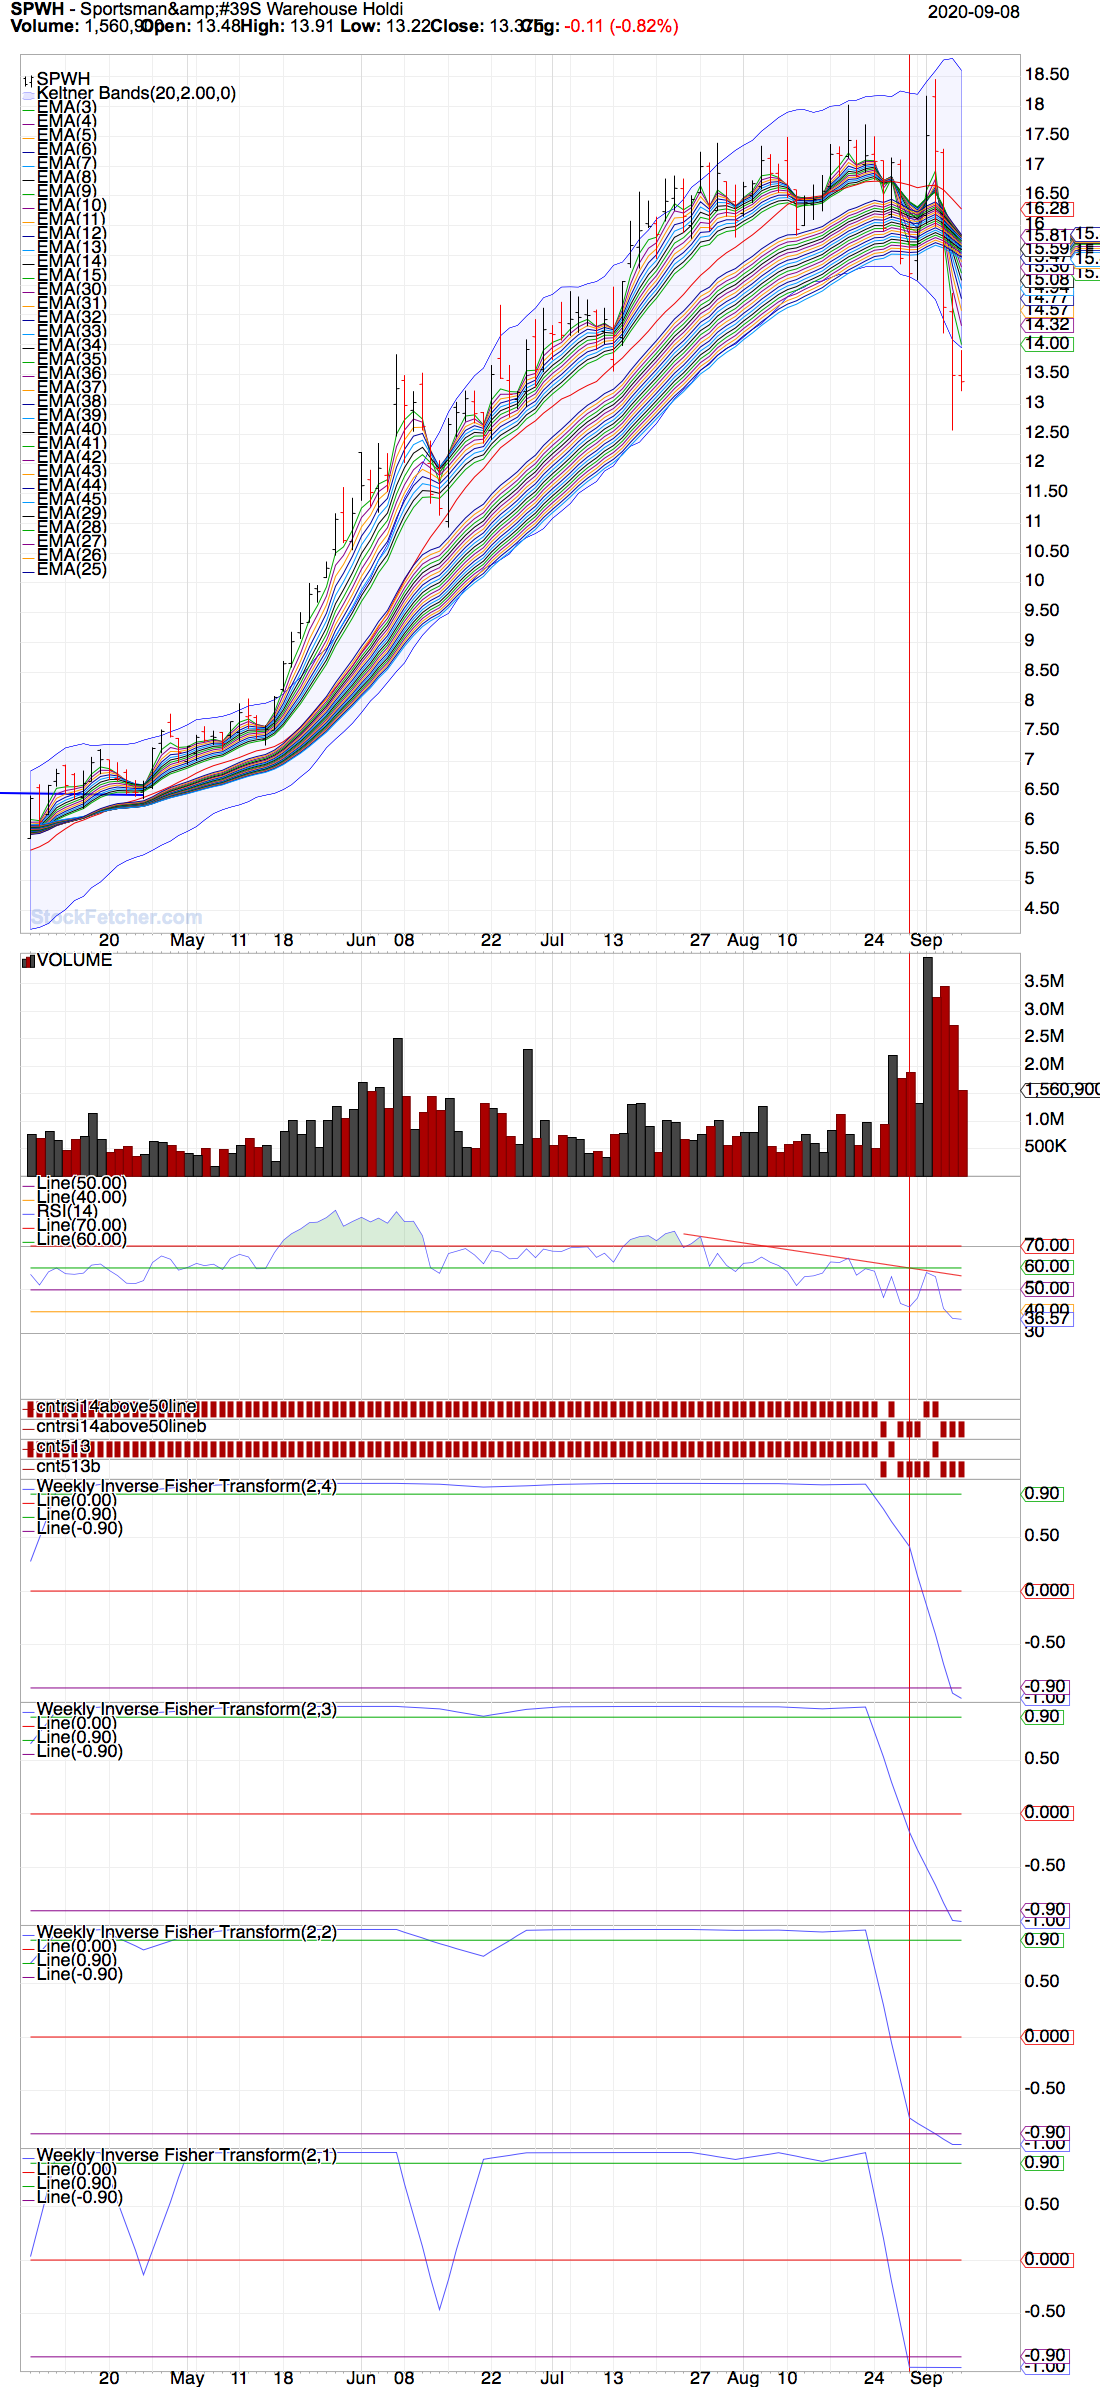 ARNC 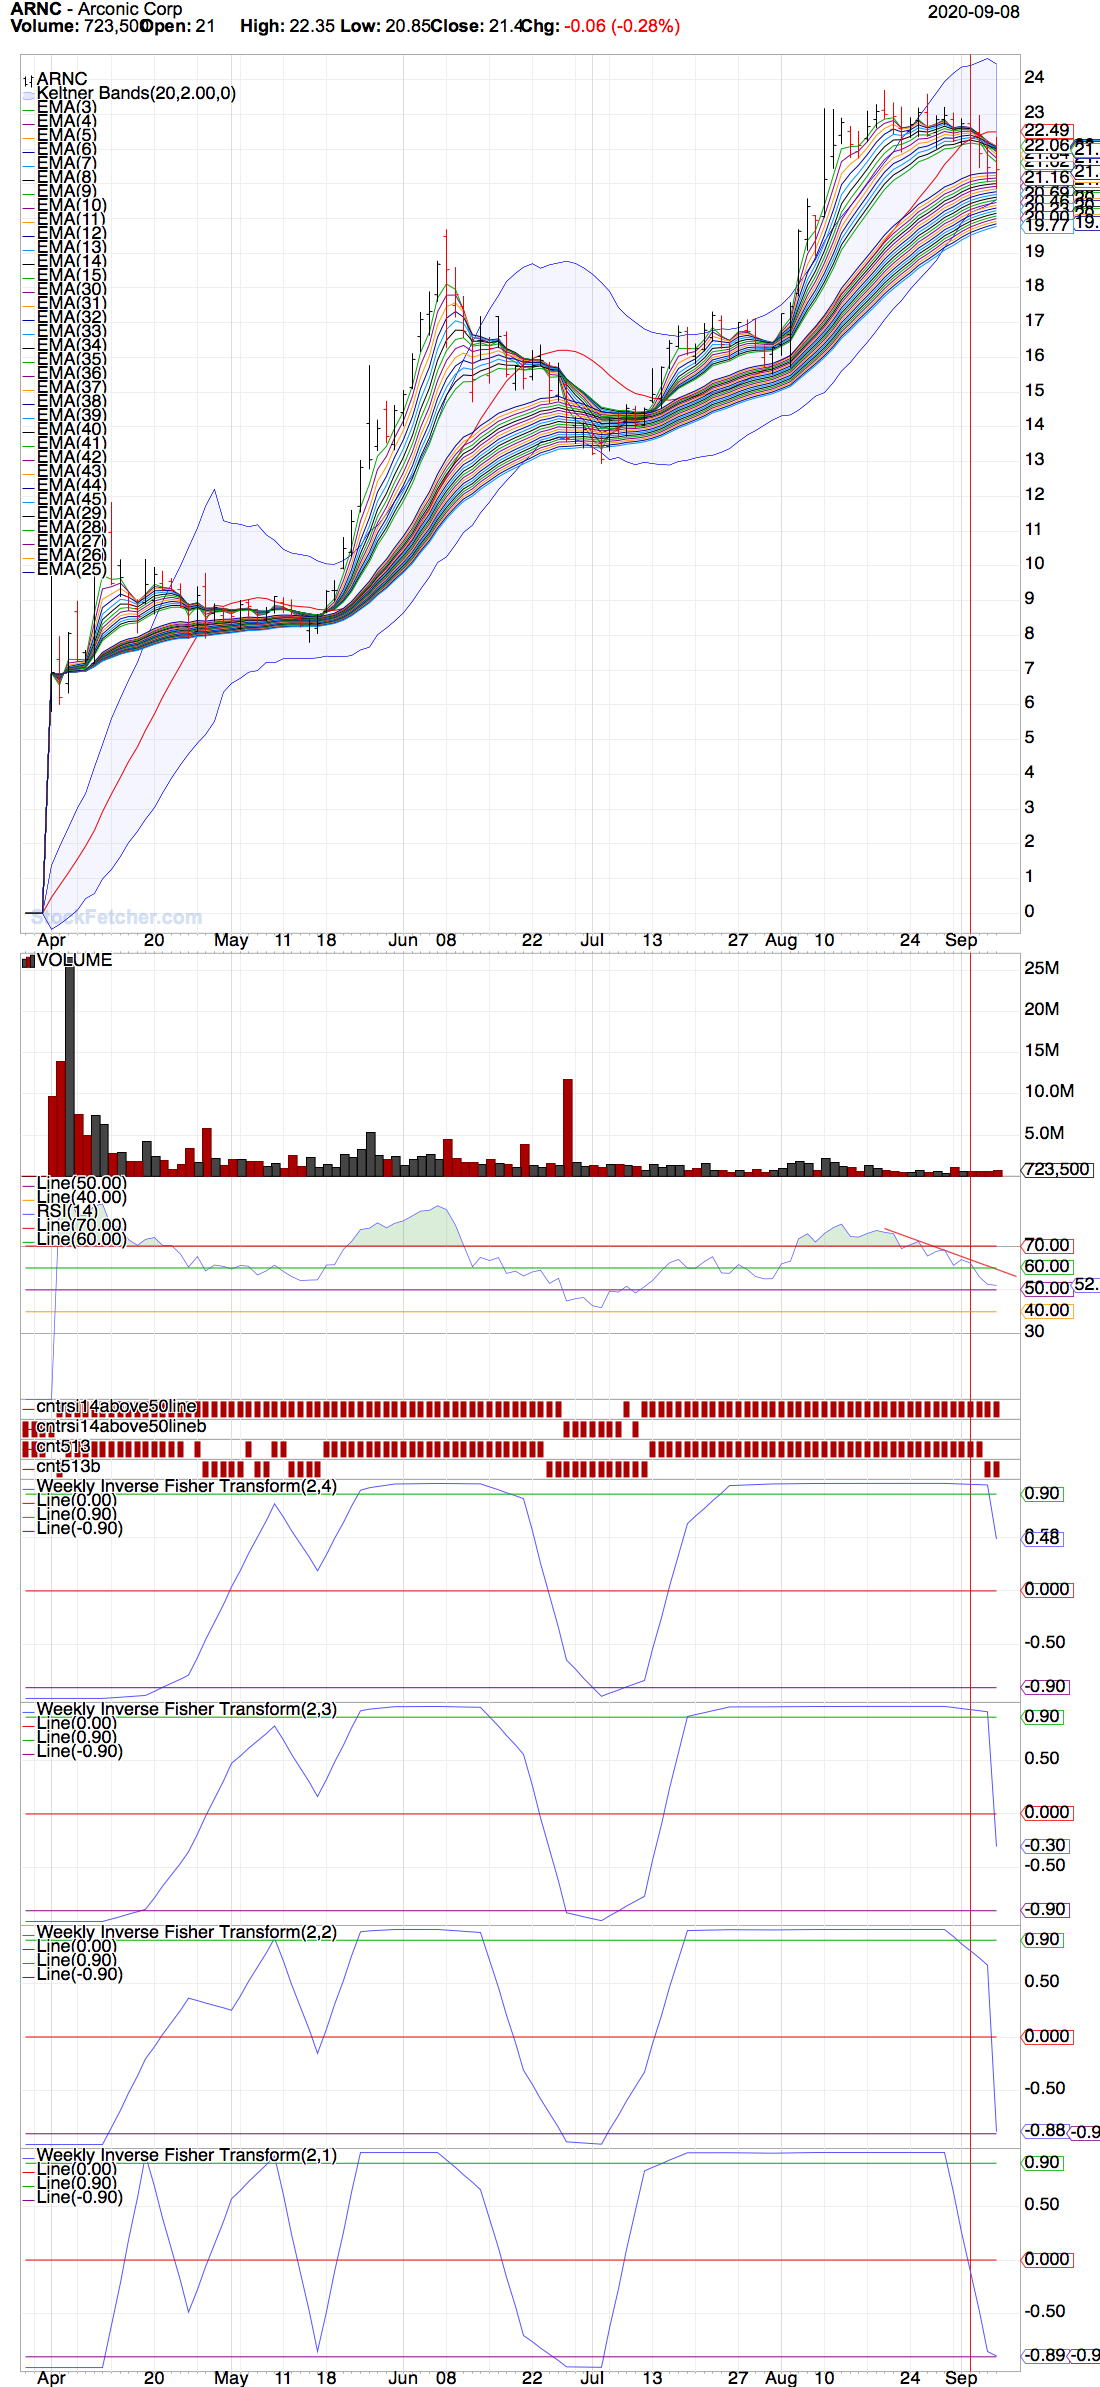 And SPY with its warning signs. I can't remember who said that every trader from hedge fund trader to the most newest trader see's the same price action. No one has a advantage. Even with Guppy MMA's there was a Guppy bubble ( over extension ) , Historical RSI(14) highs. 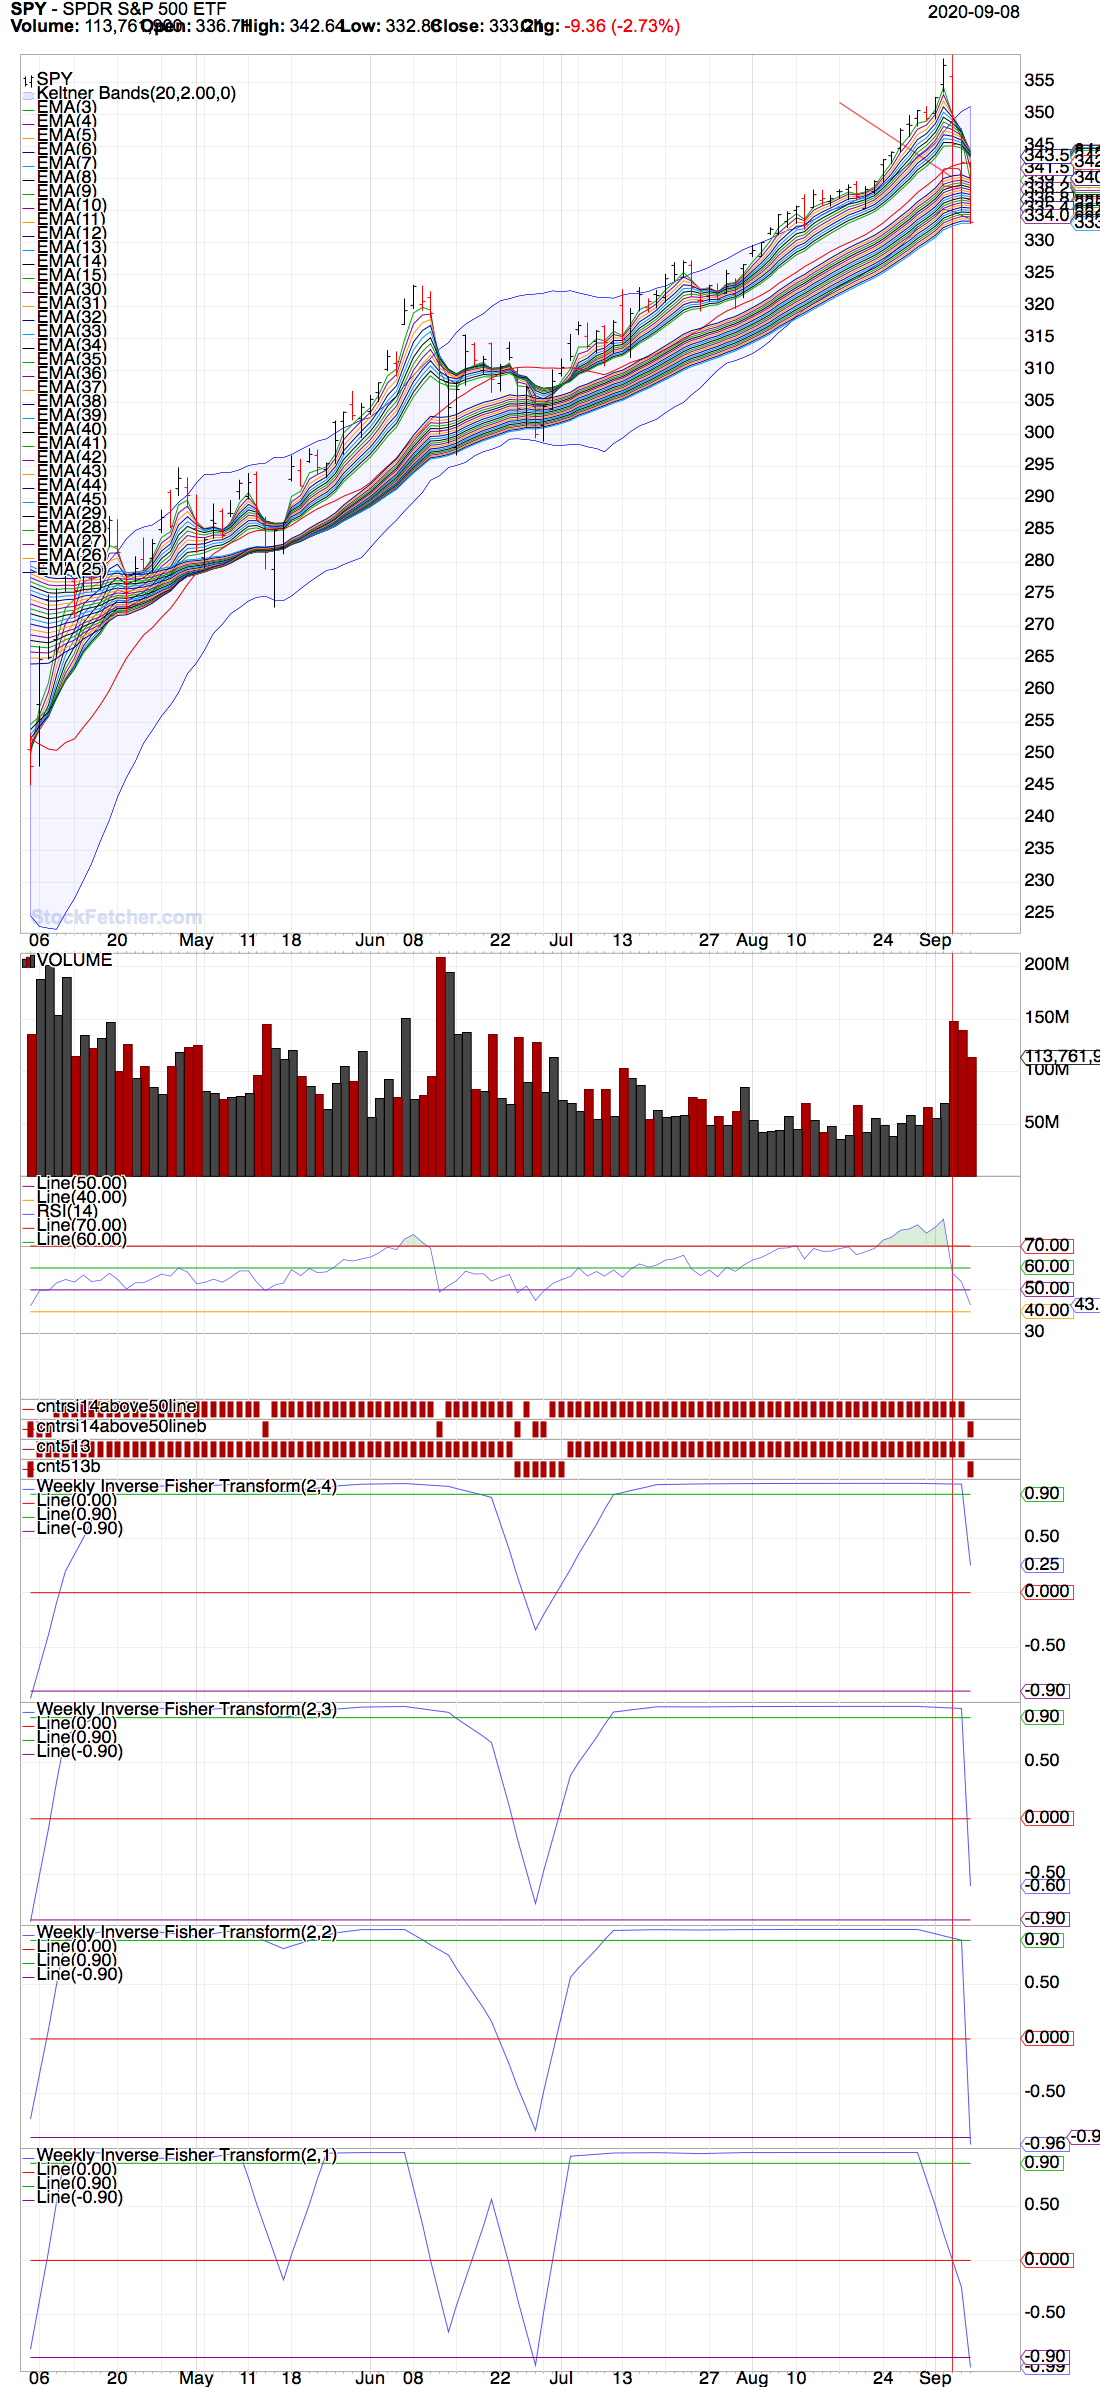 |
| Mactheriverrat 3,178 posts msg #153986 - Ignore Mactheriverrat |
9/9/2020 5:27:45 AM Add RLGY to the short side.  |
| StockFetcher Forums · Stock Picks and Trading · Short HOME | << 1 2 >>Post Follow-up |