| StockFetcher Forums · General Discussion · Stan Weinstein's Secrets For Profiting in Bull and Bear Markets | << 1 2 3 4 5 ... 11 >>Post Follow-up |
| Mactheriverrat 3,178 posts msg #148250 - Ignore Mactheriverrat modified |
6/23/2019 2:49:08 PM Buy it and read it. Best book I've read in a very long time. Found out I was was buying stocks in stage 3 instead of stage 2. All these are using the weekly charts and the 30 day average be it MA20,EMA20 or WMA20.
|
| davesaint86 726 posts msg #148256 - Ignore davesaint86 |
6/24/2019 8:40:21 AM Bought a used copy a few years ago. |
| davesaint86 726 posts msg #148257 - Ignore davesaint86 |
6/24/2019 8:42:53 AM https://www.chartmill.com/documentation.php/indicators/Weinstein-stage-analysis-in-chartmill?a=1125&cat=2 |
| Mactheriverrat 3,178 posts msg #148265 - Ignore Mactheriverrat |
6/24/2019 5:30:30 PM Roger that Davesaint86. Great link! |
| Mactheriverrat 3,178 posts msg #148284 - Ignore Mactheriverrat |
6/27/2019 2:33:54 AM On the 2nd re-read. |
| xarlor 646 posts msg #148311 - Ignore xarlor modified |
6/29/2019 10:13:54 PM I started the book this weekend. I just read chapter 1 and decided to make a filter based on his five points on pages 25-27. Color me impressed. |
| Mactheriverrat 3,178 posts msg #148312 - Ignore Mactheriverrat |
6/29/2019 11:05:51 PM A simple chart to start will do. The wma(30) is the key. On can use MA(30) or even EMA(30). I like is Weinstein's use of plan ole simple chart on a weekly chart display. Submit |
| Mactheriverrat 3,178 posts msg #148313 - Ignore Mactheriverrat |
6/29/2019 11:14:05 PM The set{x1, compare with ^SPX} draw x1 line at 0 set{x2, cma(x1,52)} draw x2 on plot x1 is a comparison with SPX but is don't show up right in sometimes. There are some other links that have be posted that show Mansfield comparison. |
| Mactheriverrat 3,178 posts msg #148314 - Ignore Mactheriverrat |
6/29/2019 11:21:56 PM Here's 2 stocks. SBLK - at a breakout. GE - near breakout. Not in SBLK but if GE can breakout I'm going to be in. 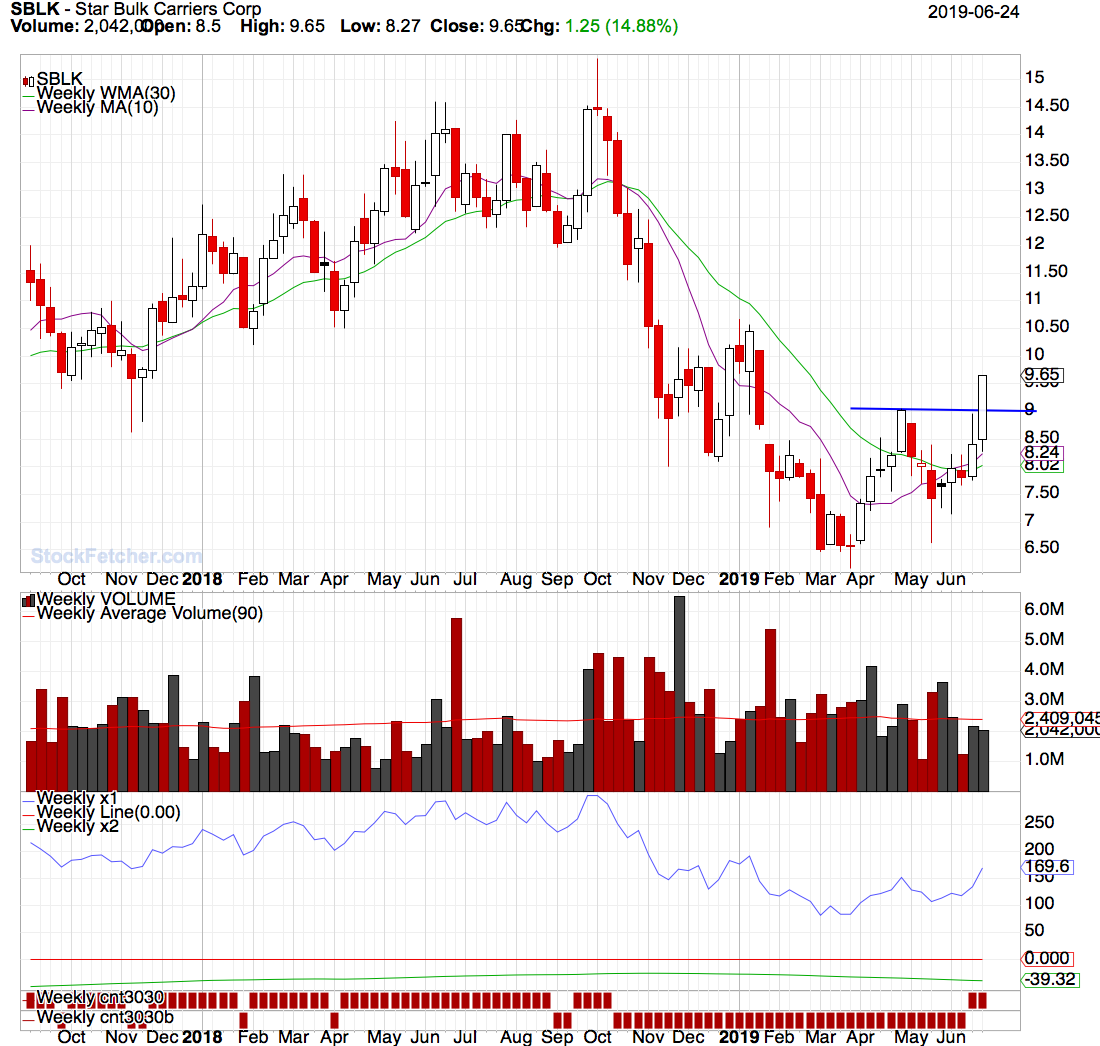  |
| volvlov 32 posts msg #148326 - Ignore volvlov |
7/1/2019 10:55:24 PM I just received my copy. It really is an excellent book! |
| StockFetcher Forums · General Discussion · Stan Weinstein's Secrets For Profiting in Bull and Bear Markets | << 1 2 3 4 5 ... 11 >>Post Follow-up |