| StockFetcher Forums · General Discussion · Need help with code for Weekly narrowing range | << 1 2 >>Post Follow-up |
| kraalarw 18 posts msg #157040 - Ignore kraalarw |
6/18/2021 10:08:28 PM I need some help with the code for (3) consecutive narrowing weekly price range bars. I only intend to run this search on Fridays (End of Week). Here is the code that I've been working on, but it doesn't give the results I'm looking for: high 2 weeks ago <= high 3 weeks ago and low 2 weeks ago >= low 3 weeks ago and high 1 week ago <= high 2 weeks ago and low 1 week ago >= low 2 weeks ago and high current week <= high 1 week ago and low current week >= low 1 week ago and price above 5 and volume above 50000 and draw Bollinger Bands(8) and draw Chaikins Volatility(8,8) and not ETF and chart-display is weekly and chart-time is 9 months Any help will be greatly appreciated! |
| redversa721 157 posts msg #157041 - Ignore redversa721 |
6/18/2021 11:32:29 PM How about using slope? Let me fiddle around and see what I can get |
| redversa721 157 posts msg #157042 - Ignore redversa721 |
6/18/2021 11:39:27 PM Something like this? |
| redversa721 157 posts msg #157043 - Ignore redversa721 |
6/18/2021 11:46:53 PM One more slightly modified |
| wantonellis 168 posts msg #157047 - Ignore wantonellis |
6/19/2021 6:57:20 AM |
| kraalarw 18 posts msg #157050 - Ignore kraalarw |
6/19/2021 4:17:34 PM I appreciate all of your efforts; however the results still are not quite what I'm looking for. Stock symbol "REKR" provides 2 recent examples of the set-up which I am trying to filter for. Using weekly charts, the 1st example starts on week-ending 11-06-20.....followed by 2 more Inside weeks. The next example with the same ticker, starts on week-ending 05-21-21..... followed by 2 more Inside weeks. I hope this clarifies what I am looking for, and again I do appreciate everyone's efforts so far. |
| redversa721 157 posts msg #157052 - Ignore redversa721 |
6/19/2021 11:57:51 PM Hi Kraal Could you please show me on a chart how this looks. You could use IMGUR to paste or slice the picture and embed in here. So based on the info below for the stock,it does not satisfy your first condition of low 2 weeks ago >= low 3 weks ago Also as you can see from the image i have linked below, the high's and low's are trending down together and the band does not seem to be narrowing or converging together. REKR Date Low High 6-Nov 3.38 3.93 30-Oct 3.92 4.35 23-Oct 5 5.34 16-Oct 5.85 6.18 [url=https://imgur.com/uLzO3h0][img]http://i.imgur.com/uLzO3h0.png[/img][/url] https://i.imgur.com/uLzO3h0.png |
| wantonellis 168 posts msg #157053 - Ignore wantonellis |
6/20/2021 8:16:06 AM Is this what you're looking for? Narrowing weekly price bars with weekly inside price bars? |
| kraalarw 18 posts msg #157056 - Ignore kraalarw |
6/20/2021 9:58:47 PM Yes, with a slight modification this is exactly what I was looking for. Thank you so much for helping me with this. |
| Nobody 404 posts msg #157059 - Ignore Nobody modified |
6/21/2021 11:22:17 AM Thank you wantonellis To: Kraalarw Would you take this from above filter? would this be a candidate to trade 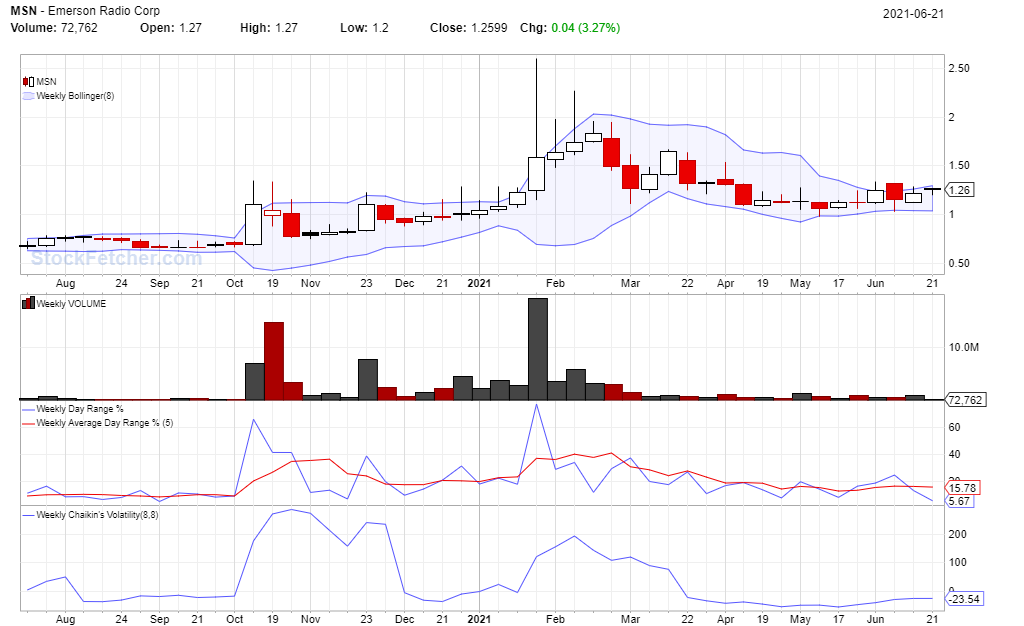 |
| StockFetcher Forums · General Discussion · Need help with code for Weekly narrowing range | << 1 2 >>Post Follow-up |