| StockFetcher Forums · General Discussion · ConnorsRSI | << 1 2 3 4 5 ... 32 >>Post Follow-up |
| evo34 82 posts msg #108942 - Ignore evo34 |
11/21/2012 4:52:56 AM Has anyone seen the new ConnorsRSI piece? You can get it for free here: http://info.tradingmarkets.com/ConnorsRSI_ConnorsRSI.html?utm_source=CRSIPromo&utm_medium=Article. Was wondering if it's possible to code the system in SF. It requires determining what percentile the prev. days return was, with respect to all daily returns for the past 100 days. Not sure if this is doable. I'd like to figure out a way to code it, so I can check some recent years performance results (as he only lists 10-yearr aggregate results) |
| klynn55 747 posts msg #108944 - Ignore klynn55 |
11/21/2012 8:17:58 AM connors wants your phone and email for the free book, so far about an hour has passed, no email yet! usually the email comes instantly. |
| evo34 82 posts msg #108960 - Ignore evo34 |
11/22/2012 2:03:18 AM For me, it went into my spam folder. |
| springhill 74 posts msg #109002 - Ignore springhill |
11/26/2012 9:59:28 AM Did anyone ever receive the ebook on connorsRSI from Connors site? I requested it last week and still nothing. |
| drew9 171 posts msg #109008 - Ignore drew9 |
11/26/2012 3:48:07 PM I got my email after about five minutes. Downloaded and I have now read it. It certainly looks possible for some of our better coders to duplicate this strategy. Lots of different statistics based on different indicator settings. |
| springhill 74 posts msg #109009 - Ignore springhill |
11/26/2012 4:10:38 PM Thanks drew9 I'll ask for it again. |
| Kevin_in_GA 4,599 posts msg #109032 - Ignore Kevin_in_GA modified |
11/27/2012 10:55:50 PM For those who have not requested this, it is worth looking at for several reasons. I was first introduced to Connors' work and systems by BarTune1 and have found that Larry Connors knows how to develop good trading systems, and how to make money selling them. This most recent system uses a proprietary oscillator that combines three distinct elements: 1. RSI(3), which by construction is an oscillator from 0 to 100, 2. The number of days up/down, normalized using an RSI-based formula to convert this to an oscillator from 0 to 100, and 3. The most recent price change, ranked as a percentile against the last 100 days. Rather than try to replicate this oscillator (which would be a real challenge) one could try small changes that get you near the same result - for example using a stochastics approach rather than the original Wilder RSI formula for 2 and 3. But before we try this, let's look at the other selection criteria Connors uses. He does not limit himself to a small set of ETFs like some of his other systems - he will trade any stock or ETF that meets the following criteria: close above 5 close is below day position(0.2,1) average volume(21) above 250000 adx(10) above 30 low below close 1 day ago * Y (where Y = 0.92 to 0.98) He then adds his proprietary indicator to the entry, and looks for a meaningful pullback the next day after the stock is highlighted (again looking at 2%, 4%, 6% or 8% further pullback in the low from the previous day's close). Looking just at the entry without using his indicator, there are only 25 variations so this is easy to run in an optimization if you have a well-defined exit. I decided just to use the RSI(2) closing above a set value (40 - 90 by units of 5) so the number went up to 275 possible combinations. Still easy to do. My backtest timeframe was 12/31/1999 through 11/16/2012, with portfolio sizes of 5 or 10 and fixed trade sizes. For example, if my portfolio is set at a max of 5 open positions, each trade is $20,000. Even if I end up making a million dollars, I still keep only 5 trades at $20,000 each as my trading capital - the rest is kept in a MMA earning 1% annually. Trades are $8.95 a side, and the bid/ask spread is set at 0.04. So how good is the basic entry without using his proprietary oscillator? Pretty damn good. Almost every variation was profitable, usually beating the S&P and having a win percentage in the mid 60% range. The variation I found to be best from a total return and risk-adjusted return perspective was this: On a further 6% pullback the next day, enter long using a limit order. Exit at the next day's open if today's closing RSI(2) > 50. The stats are as follows: STATS FOR 12/31/1999 THROUGH 11/16/2012 NUMBER OF POTENTIAL TRADES: 9,764 PORTFOLIO SIZE OF 5 - INITIAL EQUITY OF $100,000, FIXED TRADE SIZE OF $20,000 NUMBER OF TRADES: 2,052 MONTE CARLO AVERAGE PERCENT PROFITABLE: 70.08% MONTE CARLO AVERAGE TRADE RETURN: 4.26% MONTE CARLO AVERAGE ANNUAL RETURN: 135.48% MONTE CARLO AVERAGE DRAWDOWN: 10.99% PERCENT IN MARKET: 59.96% SHARPE RATIO: 1.310 PORTFOLIO SIZE OF 10 - INITIAL EQUITY OF $100,000, FIXED TRADE SIZE OF $10,000 NUMBER OF TRADES: 3,147 MONTE CARLO AVERAGE PERCENT PROFITABLE: 70.12% MONTE CARLO AVERAGE TRADE RETURN: 4.26% MONTE CARLO AVERAGE ANNUAL RETURN: 104.00% MONTE CARLO AVERAGE DRAWDOWN: 6.64% PERCENT IN MARKET: 67.14% SHARPE RATIO: 1.301 A very small set of further tweaks generated the following improvement: Same entry and exit rules as above are used STATS FOR 12/31/1999 THROUGH 11/16/2012 NUMBER OF POTENTIAL TRADES: 10,361 PORTFOLIO SIZE OF 5 - INITIAL EQUITY OF $100,000, FIXED TRADE SIZE OF $20,000 NUMBER OF TRADES: 2,109 MONTE CARLO AVERAGE PERCENT PROFITABLE: 71.35% MONTE CARLO AVERAGE TRADE RETURN: 4.92% MONTE CARLO AVERAGE ANNUAL RETURN: 161.02% MONTE CARLO AVERAGE DRAWDOWN: 9.41% PERCENT IN MARKET: 61.22% SHARPE RATIO: 1.528 PORTFOLIO SIZE OF 10 - INITIAL EQUITY OF $100,000, FIXED TRADE SIZE OF $10,000 NUMBER OF TRADES: 3,242 MONTE CARLO AVERAGE PERCENT PROFITABLE: 71.35% MONTE CARLO AVERAGE TRADE RETURN: 4.91% MONTE CARLO AVERAGE ANNUAL RETURN: 123.40% MONTE CARLO AVERAGE DRAWDOWN: 5.55% PERCENT IN MARKET: 67.27% SHARPE RATIO: 1.402 OK, I like this. The filters do not generate that many trades, so using limit orders on all of them would not be too onerous, or you could watch them and just enter at some point after the 6% dip was confirmed. This is a very profitable approach, which did astoundingly well during a very rough 13 year period for most investors. However, backtesting like this has an uncanny ability to successfully predict the past but not the future. Not really a surprise to many here that systems that look great in backtesting do not deliver on that promise going forward. I will post several walk-forward analyses on this system tomorrow (for those who do not know, a walk-forward analysis uses a prior period of time (say 1-3 years) to optimize the best variant of a system, then trades it against new market data for a month or so, then re-optimizes sliding the look-back period forward a month. This is done over and over again so that the system is always tested against naive data to avoid bias). |
| Cheese 1,374 posts msg #109034 - Ignore Cheese |
11/27/2012 11:30:56 PM Kevin, thank you for your generous contribution. |
| evo34 82 posts msg #109039 - Ignore evo34 |
11/28/2012 1:07:33 AM Curious what the returns are for the last 2 years? I would guess not so hot. If I am wrong, I'll be impressed. |
| Kevin_in_GA 4,599 posts msg #109041 - Ignore Kevin_in_GA modified |
11/28/2012 7:08:28 AM Initial equity on 12/31/1999: $100,000.00 Equity on 11/16/2010: $1,248,990.98 Equity on 11/16/2011: $1,324,500.16 (net gain of $75,509.18 - a return of 75.5% on $100,000 trading capital used) Equity on 11/16/2012: 1,385,476.55 (net gain of $60,976.39 - a return of 60.9% on $100,000 trading capital used) Net gain of $136,485.47 over the last two years (136%). This performance is based on selecting the lowest RSI(2) stocks that triggered for that specific day. In reality that almost never would happen since you simply get the first 5 or 10 that trigger. That's why I look at Monte Carlo results (here we used 1000 random combinations of stocks to generate the average returns). Here is the equity curve for the backtest. This is not the MC results, but those for the lowest RSI(2) selection method. The white line is the S&P 500 performance over the same period. 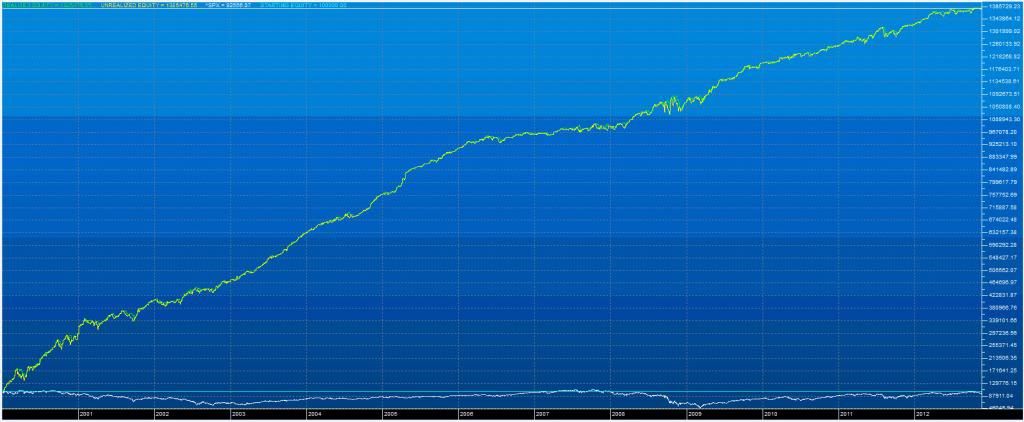
Kevin |
| StockFetcher Forums · General Discussion · ConnorsRSI | << 1 2 3 4 5 ... 32 >>Post Follow-up |