| StockFetcher Forums · General Discussion · !0/21 week convergence help please? | << >>Post Follow-up |
| Smpoll 79 posts msg #161085 - Ignore Smpoll |
5/15/2024 1:24:04 PM Hi- I have a script that isn't pulling up stocks where only the 10 and 21 SMA converge. I'm getting a lot of other hits as well. It should be a very simple request of the scanner and not sure where to edit this script? Thank you for anyone's help. chart-display is weekly chart-length is 14 months close is less than 30 percent below the 52 week high Show stocks where the average day range (50) is above 1.5% and price is greater than 15 price is above MA(200) and volume is greater than 100000 add column average volume (30) add column average true range (22) add column average day range (50) sort column 7 descending SET{VHISTO,MACD HISTOGRAM} draw EMA(8) draw EMA(9) draw EMA(10) draw EMA(21) draw MA(40) draw MA(50) draw MA(118) DRAW MACD DRAW VHISTODN ON PLOT VHISTO DRAW VHISTOUP ON PLOT VHISTO draw RSI(StochRSI(14,14) |
| Smpoll 79 posts msg #161086 - Ignore Smpoll |
5/15/2024 1:51:22 PM Examples: Basically setups for Pullback Reversals on the weekly 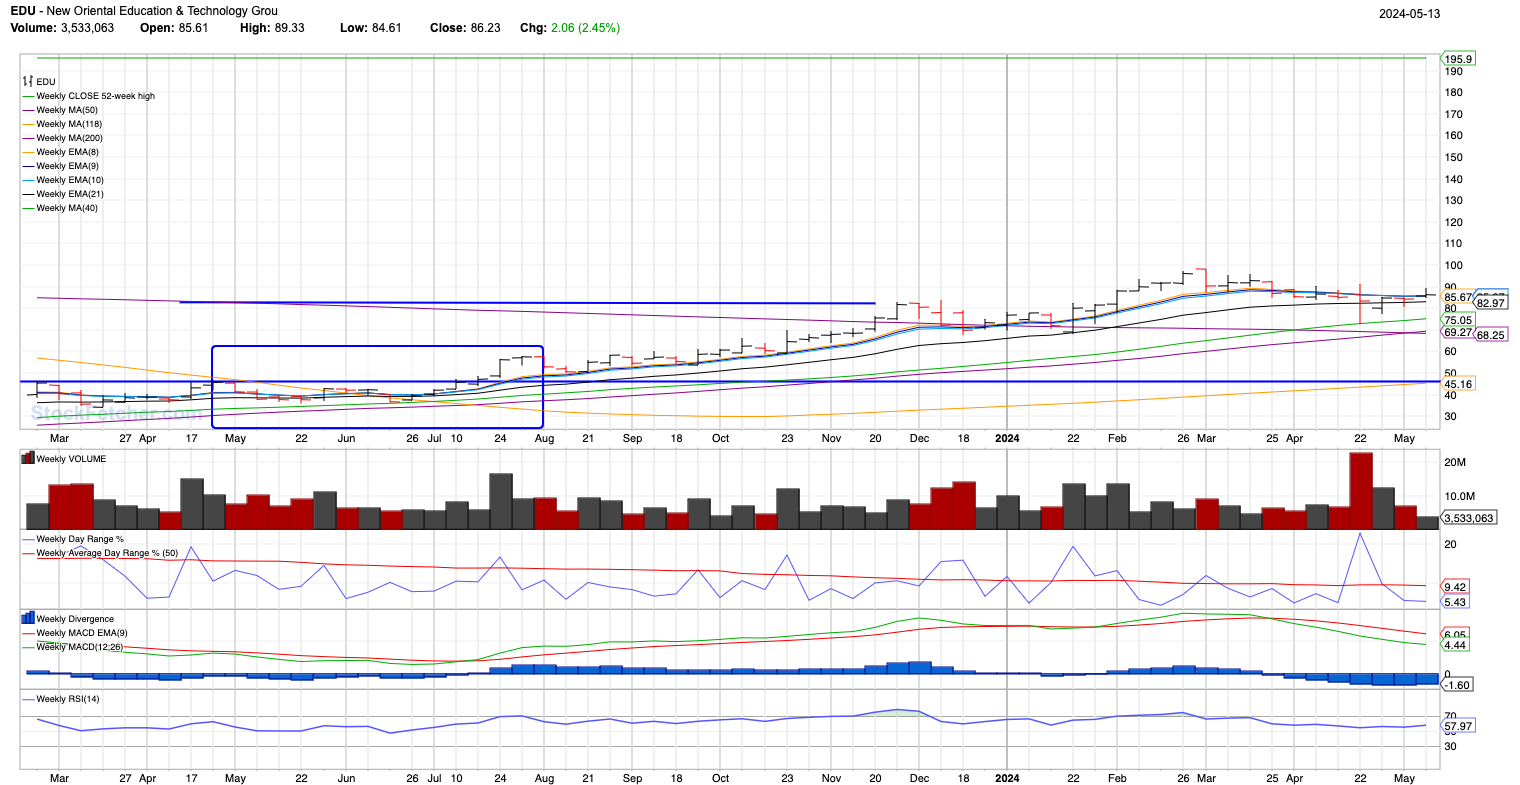  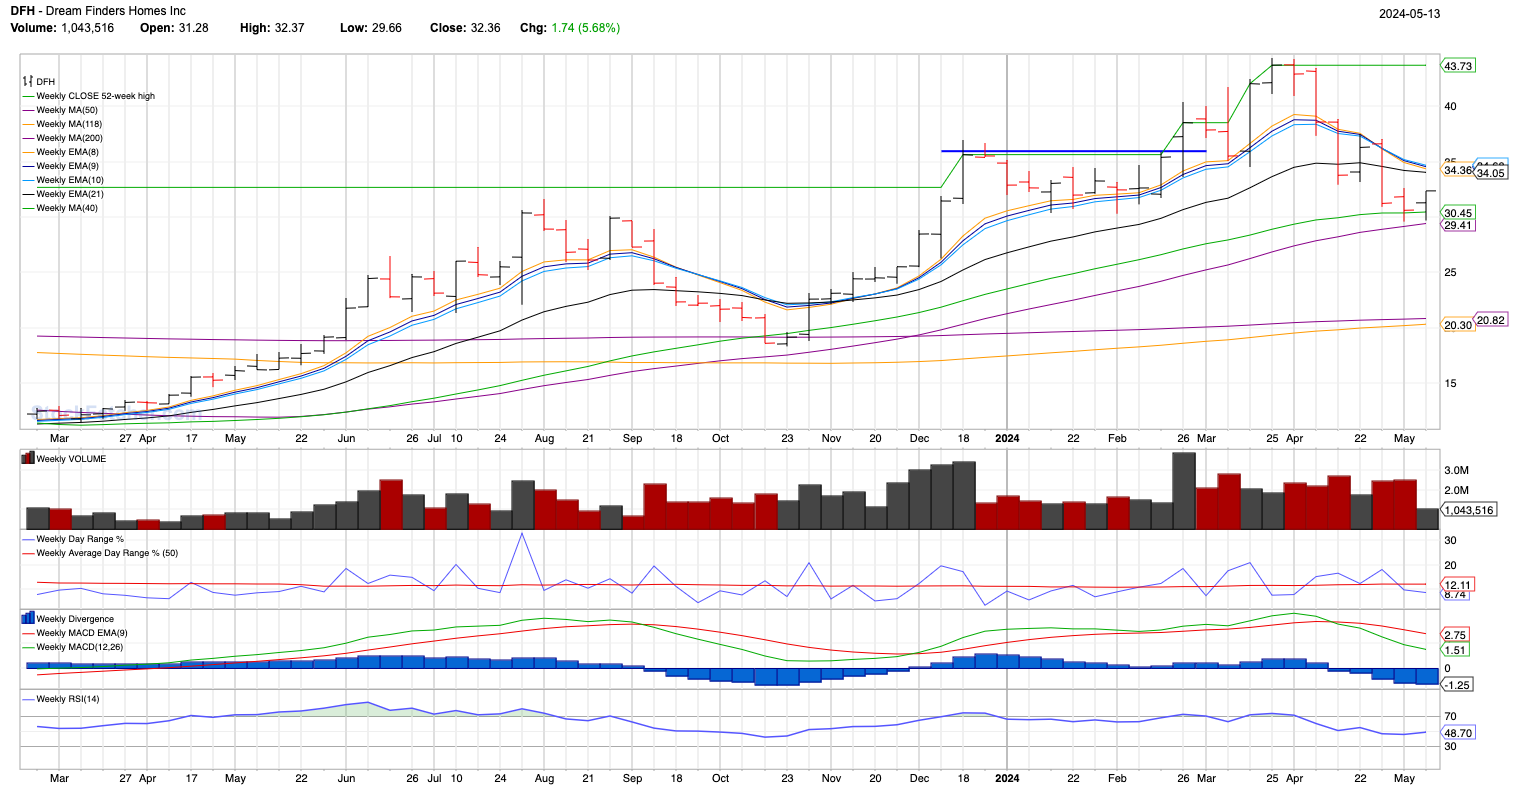 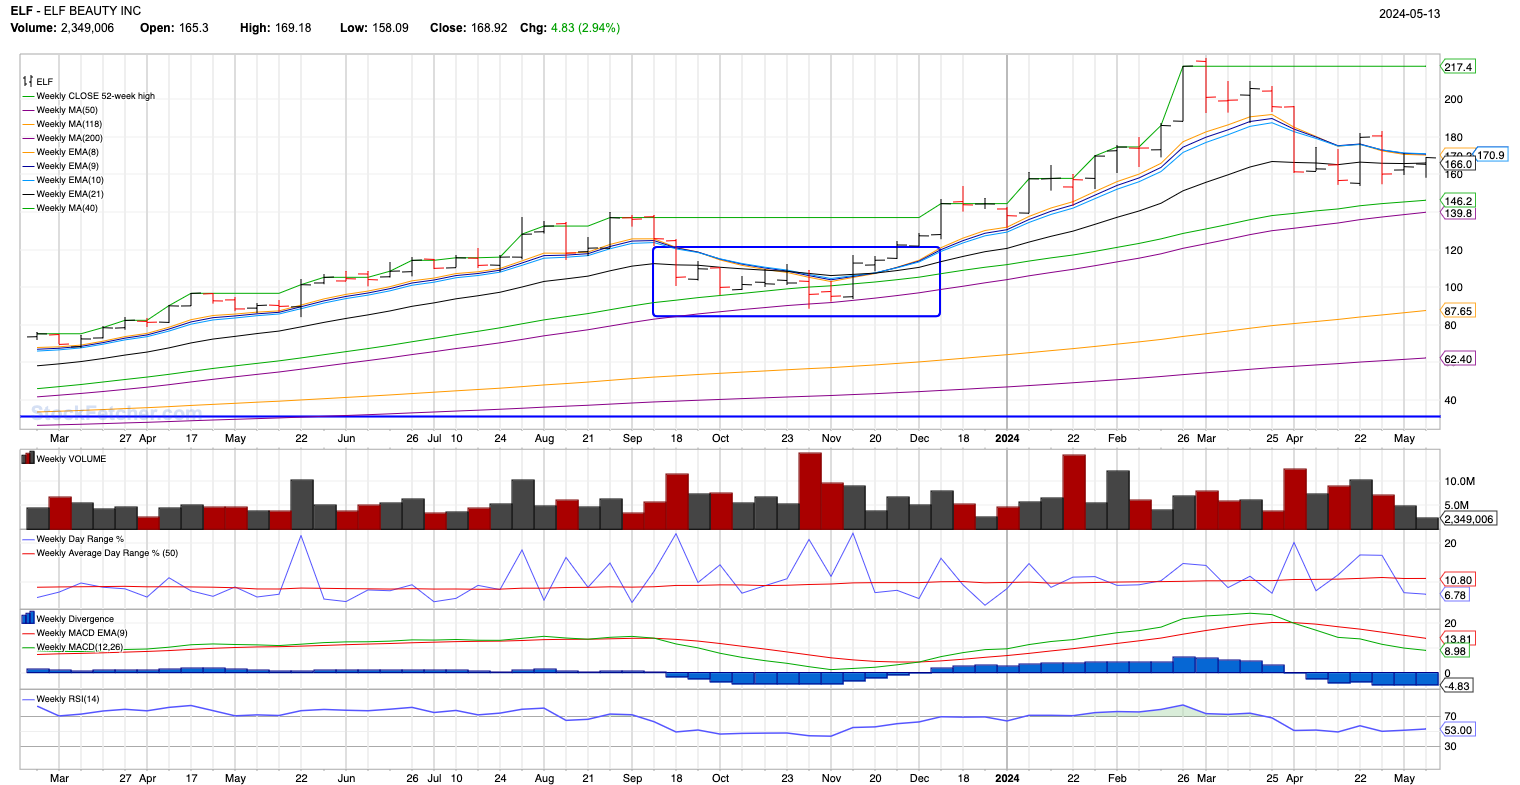 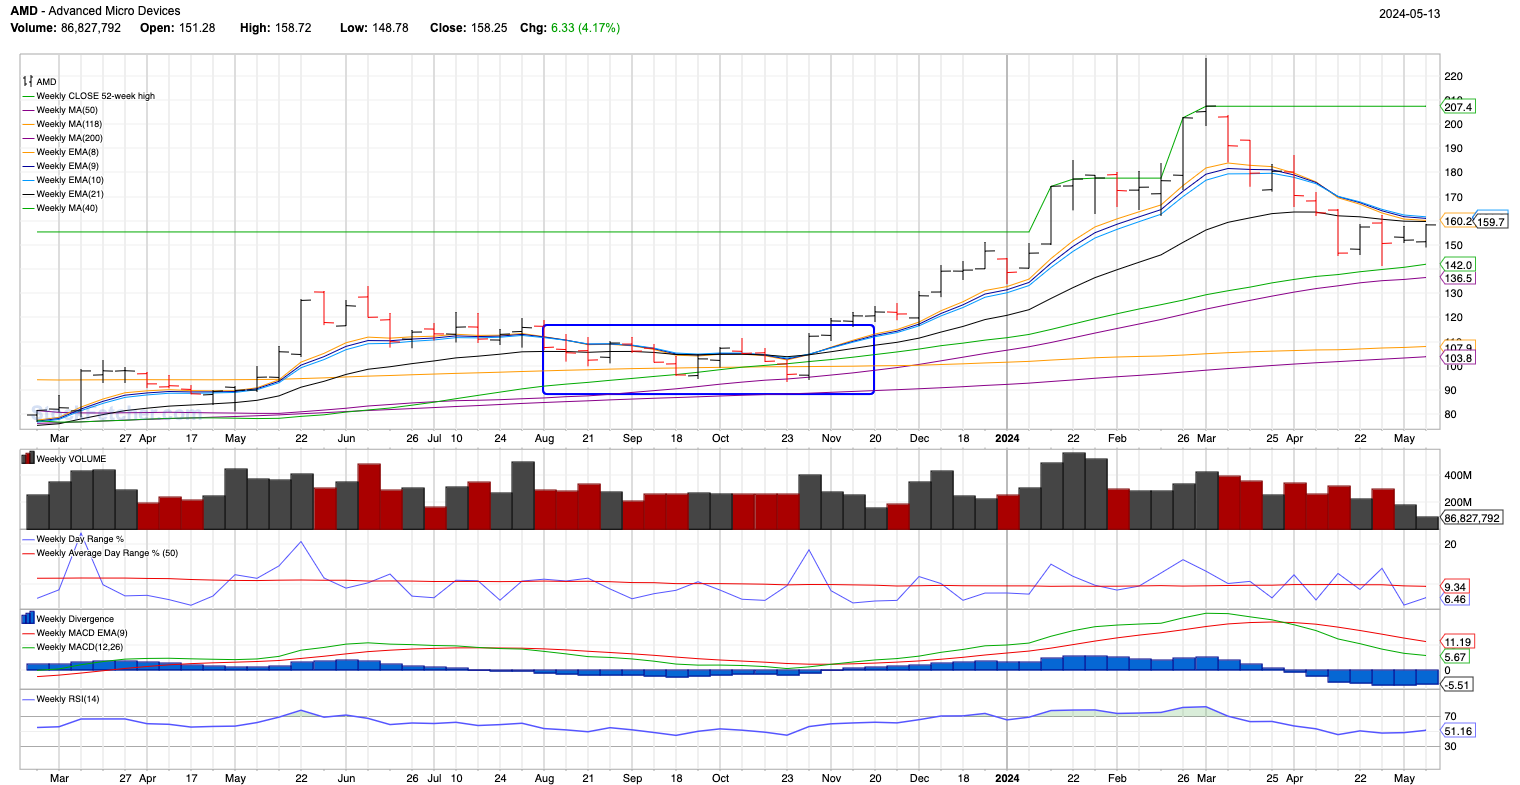 |
| xarlor 646 posts msg #161090 - Ignore xarlor |
5/17/2024 1:06:31 PM No where in the filter are you asking it to show only tickers with a ma(10) and ma(21) convergence. Here is one way to do it. added:
Adjust how long you want the convergence to be by changing "last week" to "last 2 weeks", "last 3 weeks", etc. |
| Smpoll 79 posts msg #161091 - Ignore Smpoll |
5/17/2024 1:29:48 PM Thank you. What seemed to work best so far was creating "last 1 week", that pulled up more hits than "last week". When I added addt'l weeks there were 1 or 2 hits. Still wondering if this can be tweaked for more of what I'm looking for, i.e.: 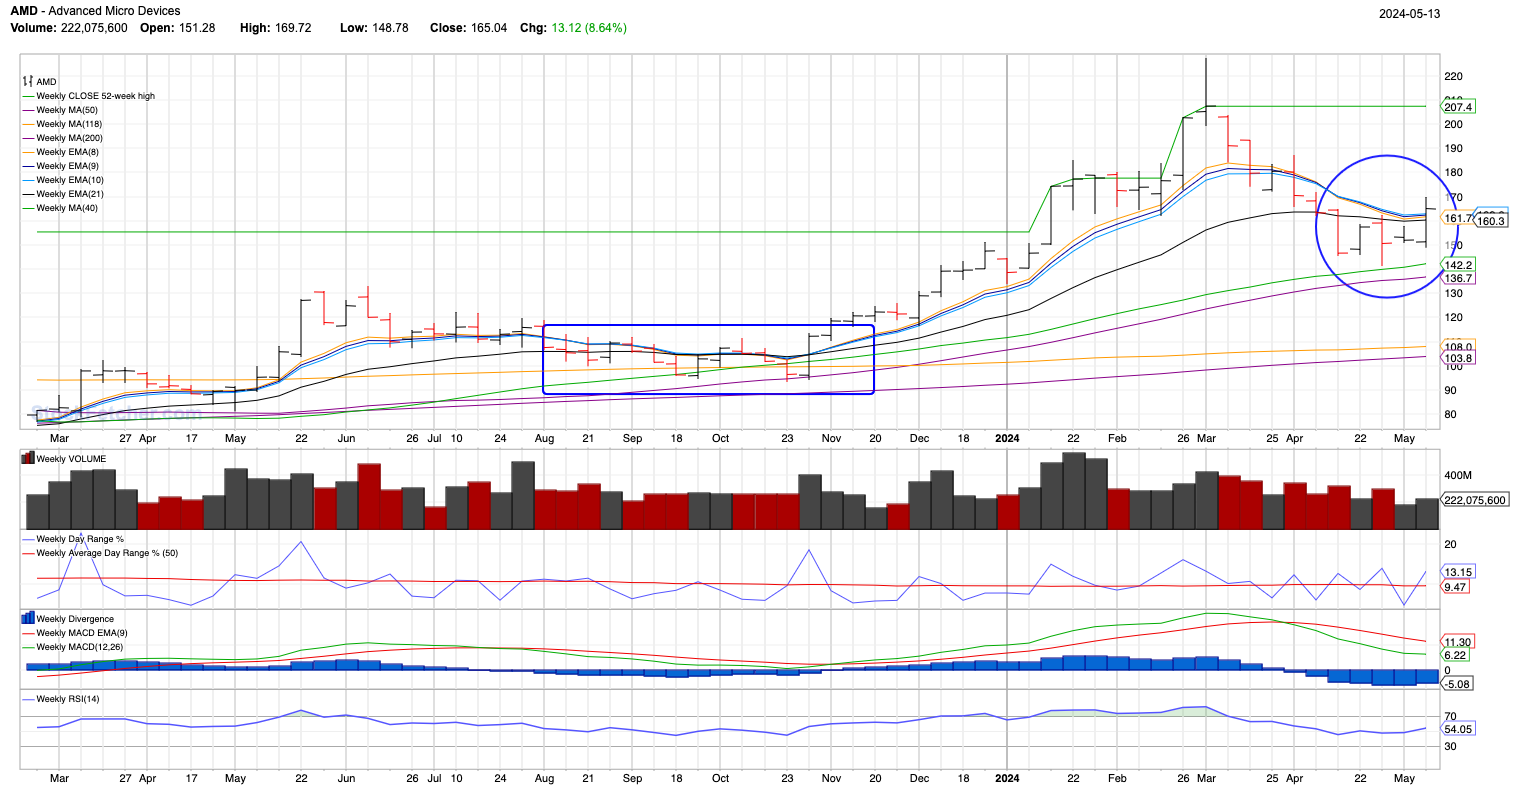 |
| Smpoll 79 posts msg #161099 - Ignore Smpoll |
5/20/2024 7:53:05 PM Xarlor- I owe you an apology, after more research, I’ve found that your help was instrumental in weeding out many irrelevant charts and therefore saving me a lot of time! So, my apologies again for seeming ungrateful at first and thank you again. |
| StockFetcher Forums · General Discussion · !0/21 week convergence help please? | << >>Post Follow-up |