| StockFetcher Forums · Filter Exchange · The RED LIGHT ... GREEN LIGHT Trading System ! | << 1 2 3 4 >>Post Follow-up |
| marine2 963 posts msg #117424 - Ignore marine2 |
12/19/2013 12:20:41 AM Hard to beat the SPY, QQQ, and DIA, over time if you did the buy and hold back in 2009 until now. But if it did prove this technique shown here on Alf's Sar chart can identify fairly quickly short term buy and sell points without the use of writing a custom filter and make money doing it I say heck yes, go for it. You can not backtest this because there is nothing to grab for testing. You would need to base your regular stock picks off buy or sell points via the buy and sell points of the major sector ETF's and the market's ETF's. Alf is just thinking out of the box and creating an interesting twist on stock trading. |
| alf44 2,025 posts msg #117427 - Ignore alf44 modified |
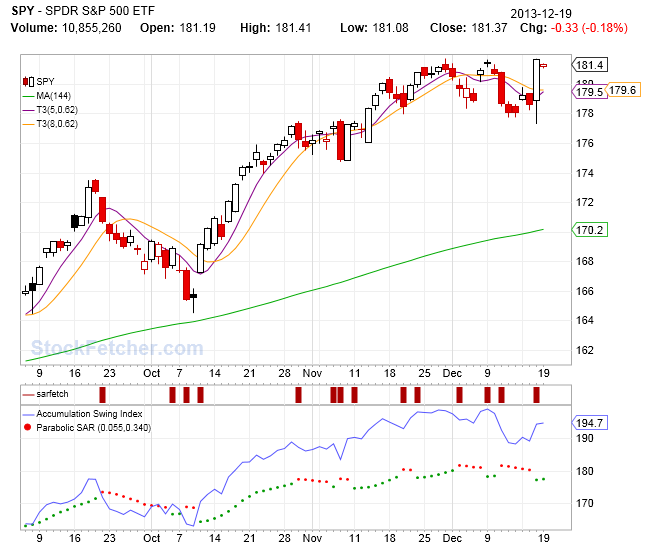
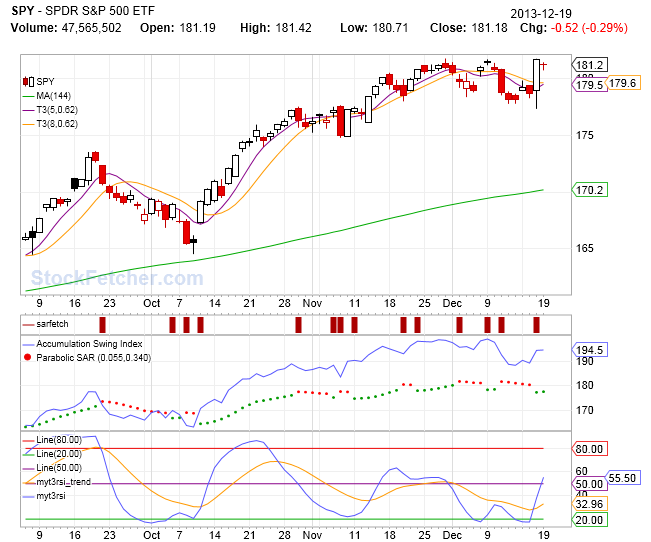
12/19/2013 10:35:04 AM UPDATES : 1.)  . ----- This adds / includes some code info that displays each SAR "flip" ... ( "SARfetch" ) It would be great if these SAR "flips" could be displayed as RED / GREEN ... but, StockFetcher doesn't currently allow this ! THAT is unfortunate !!! 2.)  . ----- This adds / includes a Short-Term Momentum Indicator that I "created". It is basically a short-term price oscillator (think MACD) married with an 8 period Custom RSI. It uses Tillson Adaptable MAs ( 5 period and an 8 period ... same as are overlayed on the price plot ) with a 13 period EMA "slow line". It is essentially two indicators in one and provides a ton of information ... all while being conveniently "stuffed" in a single package ! . |
| duke56468 683 posts msg #117429 - Ignore duke56468 modified |
12/19/2013 11:28:06 AM Is there a reason you don't put the P-Sar on plot price? |
| marine2 963 posts msg #117436 - Ignore marine2 |
12/19/2013 1:34:01 PM I agree with you Alf. The flips are actually gaps in the P-Sar configuration. The original programmer that mathematically created the P-Sar could put this into his coding as an enhancement to his original code. Everytime there's a gap his coding changes to the other color depending on up and down direction. I commend Alf in showing us this new action view on each stock / equity that is of interest to a trader. |
| alf44 2,025 posts msg #117445 - Ignore alf44 modified |
12/19/2013 3:06:28 PM "duke" "Is there a reason you don't put the P-Sar on plot price? --- First of all, I love the indicator ... I just don't find it to be that useful to me plotted on price and used as a "Trailing Stop" ... ... so I began to play around with the "step" and "maximum step" parameters to try and make it MORE sensitive. In doing that, the idea came that maybe I could actually remove it completely from the price plot and use it instead ... as a sort of "momentum indicator" that could be plotted in an entirely different way. So that led to the way you see it plotted here. Plotting the P-SAR along with the Accumulative Swing Index "seemed" like a natural as BOTH of these indicators were developed by Welles Wilder. I also happen to like the ASI for other reasons. There IS a bit of a problem with this approach however. The ASI is well ... "accumulative" ... that is ... over time it's value can become VERY POSITIVE or VERY NEGATIVE ! When that happens, the P-SAR values which are still based on Price ... and the ASI values which have NOTHING to do with Price ... can become SO far apart that it results in a plot in which BOTH can become very compressed and look a bit odd. I don't like this occasional "glitch" when displaying both (ASI & P-SAR) together ... but, I haven't come up with a better idea as of yet. --- When plotted separately from price the "more sensitive" P-SAR (especially now that it plots red / green) ... becomes an indicator that is visual in a way we have never seen before here at StockFetcher ... AND ... one with many NEW interesting possibilites. IMO In addition, it also allows for a less cluttered price chart ... and ... for a bit of a cleaner look. But, HEY ... to each his own ! If you prefer it plotted on price ... there is certainly nothing wrong with doing it the way it was intended ! LOL . |
| scott111552 173 posts msg #117457 - Ignore scott111552 |
12/20/2013 8:43:42 AM Excellent work, Alf..... |
| alf44 2,025 posts msg #117459 - Ignore alf44 |
12/20/2013 11:42:59 AM . Thanks ! . |
| mktmole 325 posts msg #117461 - Ignore mktmole |
12/20/2013 2:05:00 PM ditto! |
| SAFeTRADE 659 posts msg #117466 - Ignore SAFeTRADE |
12/20/2013 8:24:46 PM Head! |
| jimmyjazz 102 posts msg #117467 - Ignore jimmyjazz |
12/20/2013 8:49:30 PM Kevin's questions seem very reasonable. If you look at the red/green transitions on SPY, it's clear you'll get whipsawed terribly before SPY finally starts a long uptrend. At the risk of incurring alf's hair trigger ire . . . alf, have you actually traded this? I'm not sure I see the value. |
| StockFetcher Forums · Filter Exchange · The RED LIGHT ... GREEN LIGHT Trading System ! | << 1 2 3 4 >>Post Follow-up |