| StockFetcher Forums · Filter Exchange · Ema(10) and Upper Bollinger Band(20,0.25) - Bullish filter. | << >>Post Follow-up |
| Mactheriverrat 3,178 posts msg #151960 - Ignore Mactheriverrat modified |
4/29/2020 3:01:45 PM UPDATED Code 4-30-2020 @ 9:30 C.S.T. 1st filter is ema(10) crossed above upper Bollinger Band(20,0.25) Submit 2nd filter is ema(10) is above upper Bollinger Band(20,0.25) Submit |
| Cheese 1,374 posts msg #151961 - Ignore Cheese |
4/29/2020 3:53:41 PM Thank you, Mac. Very kind of you. Many picks (some airlines currently) look sick even though they satisfy the conditions. Any suggestions to make safer picks, and any code for signals while we wait for BB to expand and climb? |
| Mactheriverrat 3,178 posts msg #151963 - Ignore Mactheriverrat modified |
4/29/2020 5:13:39 PM I kind of look for a squeeze then the breakout on the Upper and lower Bollinger Band(20,2) like BLUE 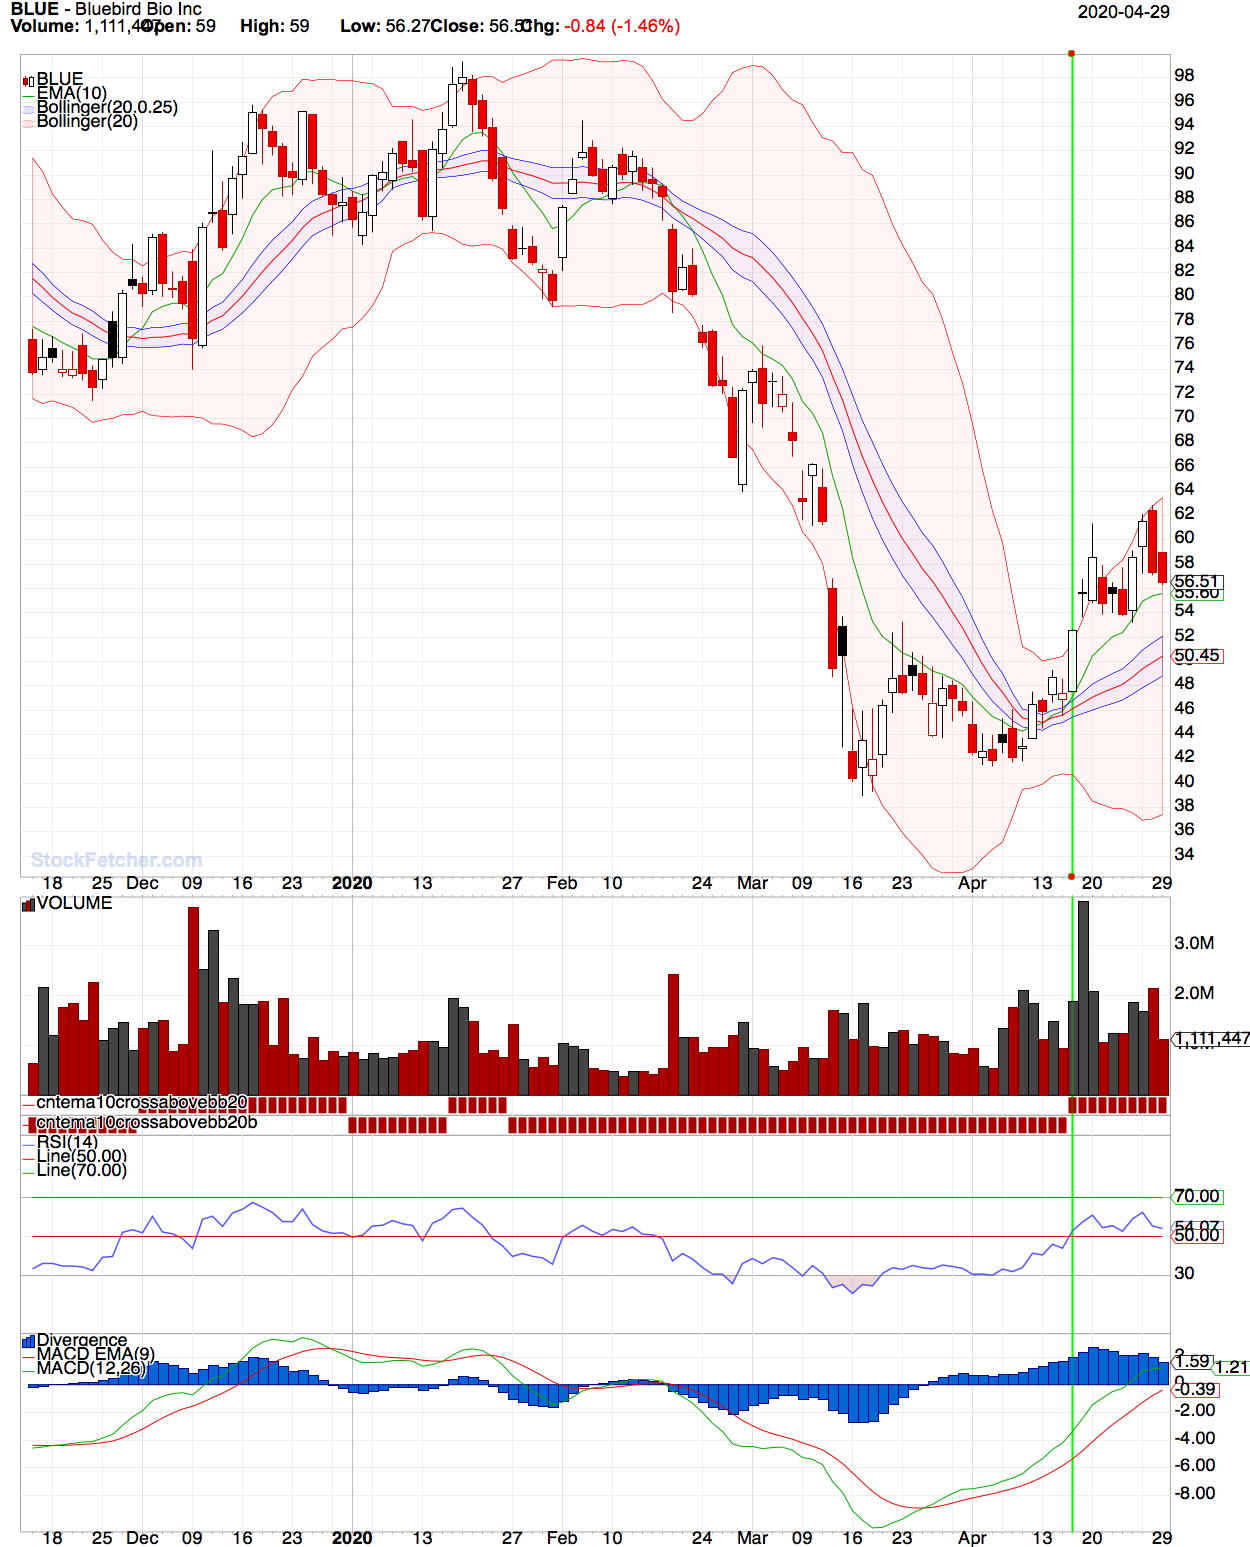 SAVE 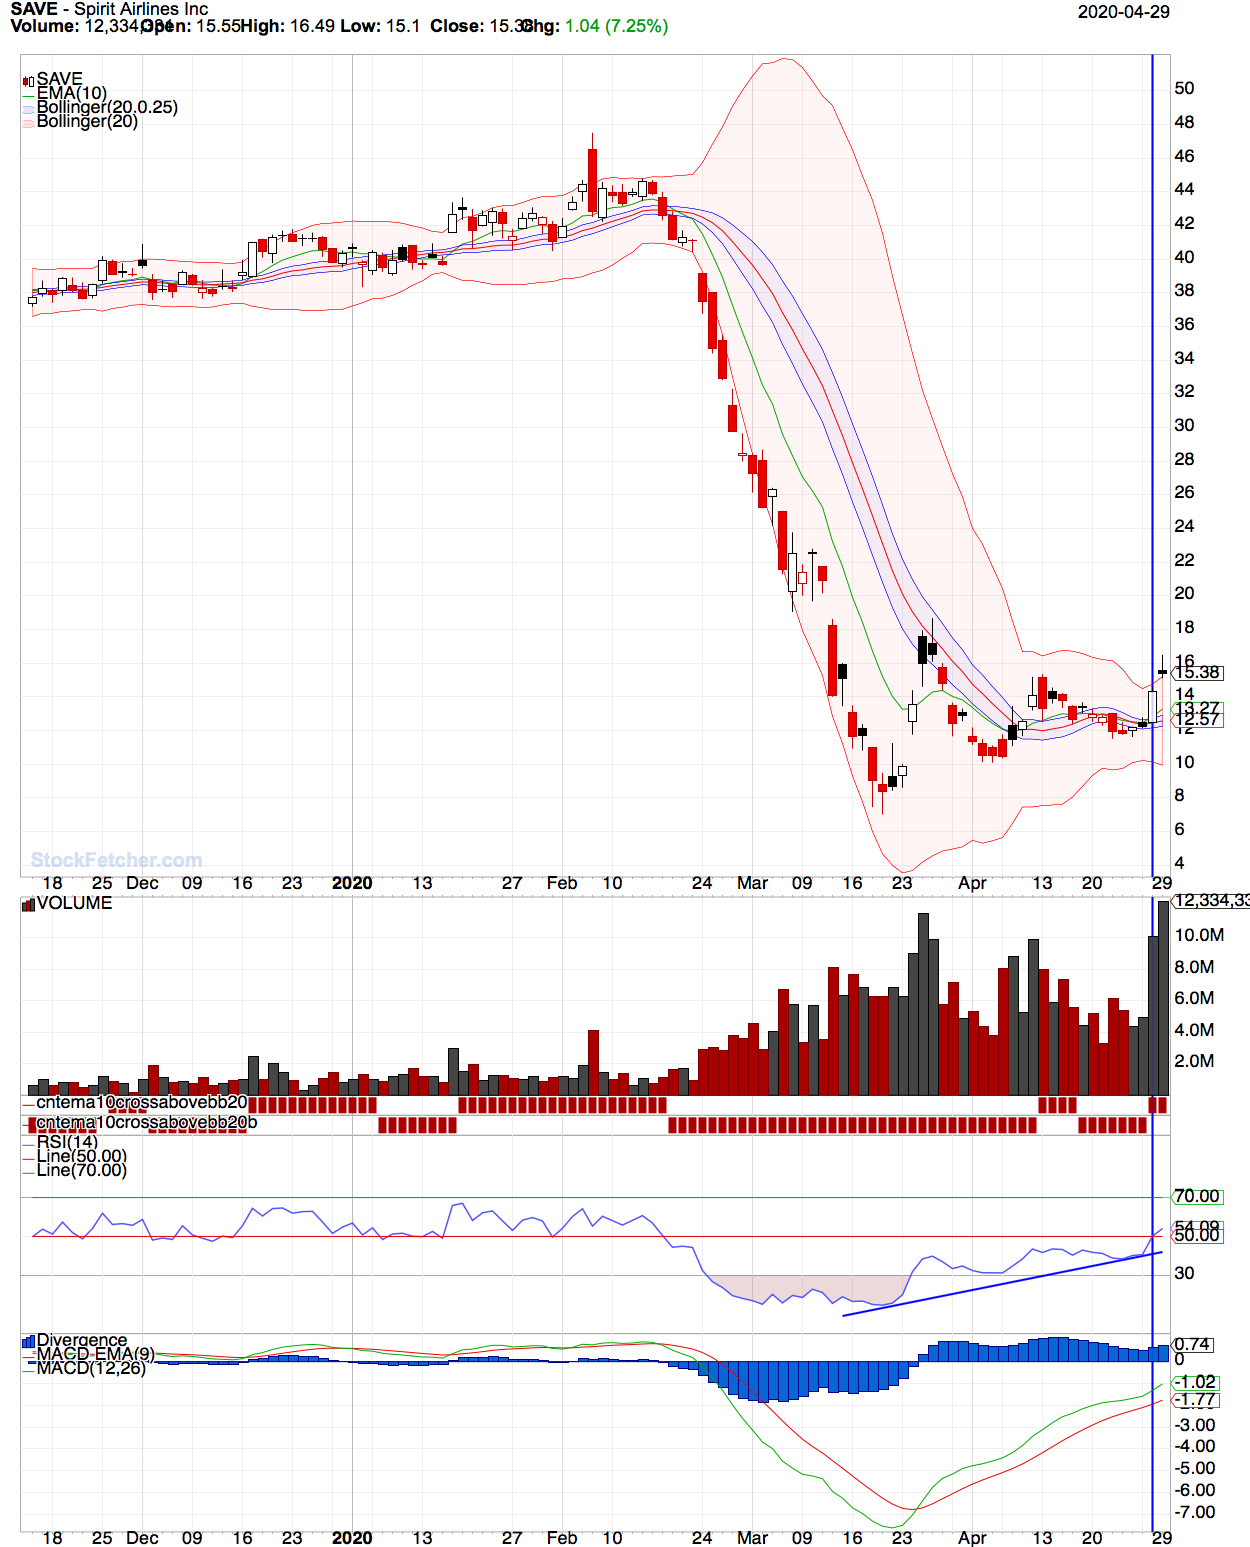 BBBY 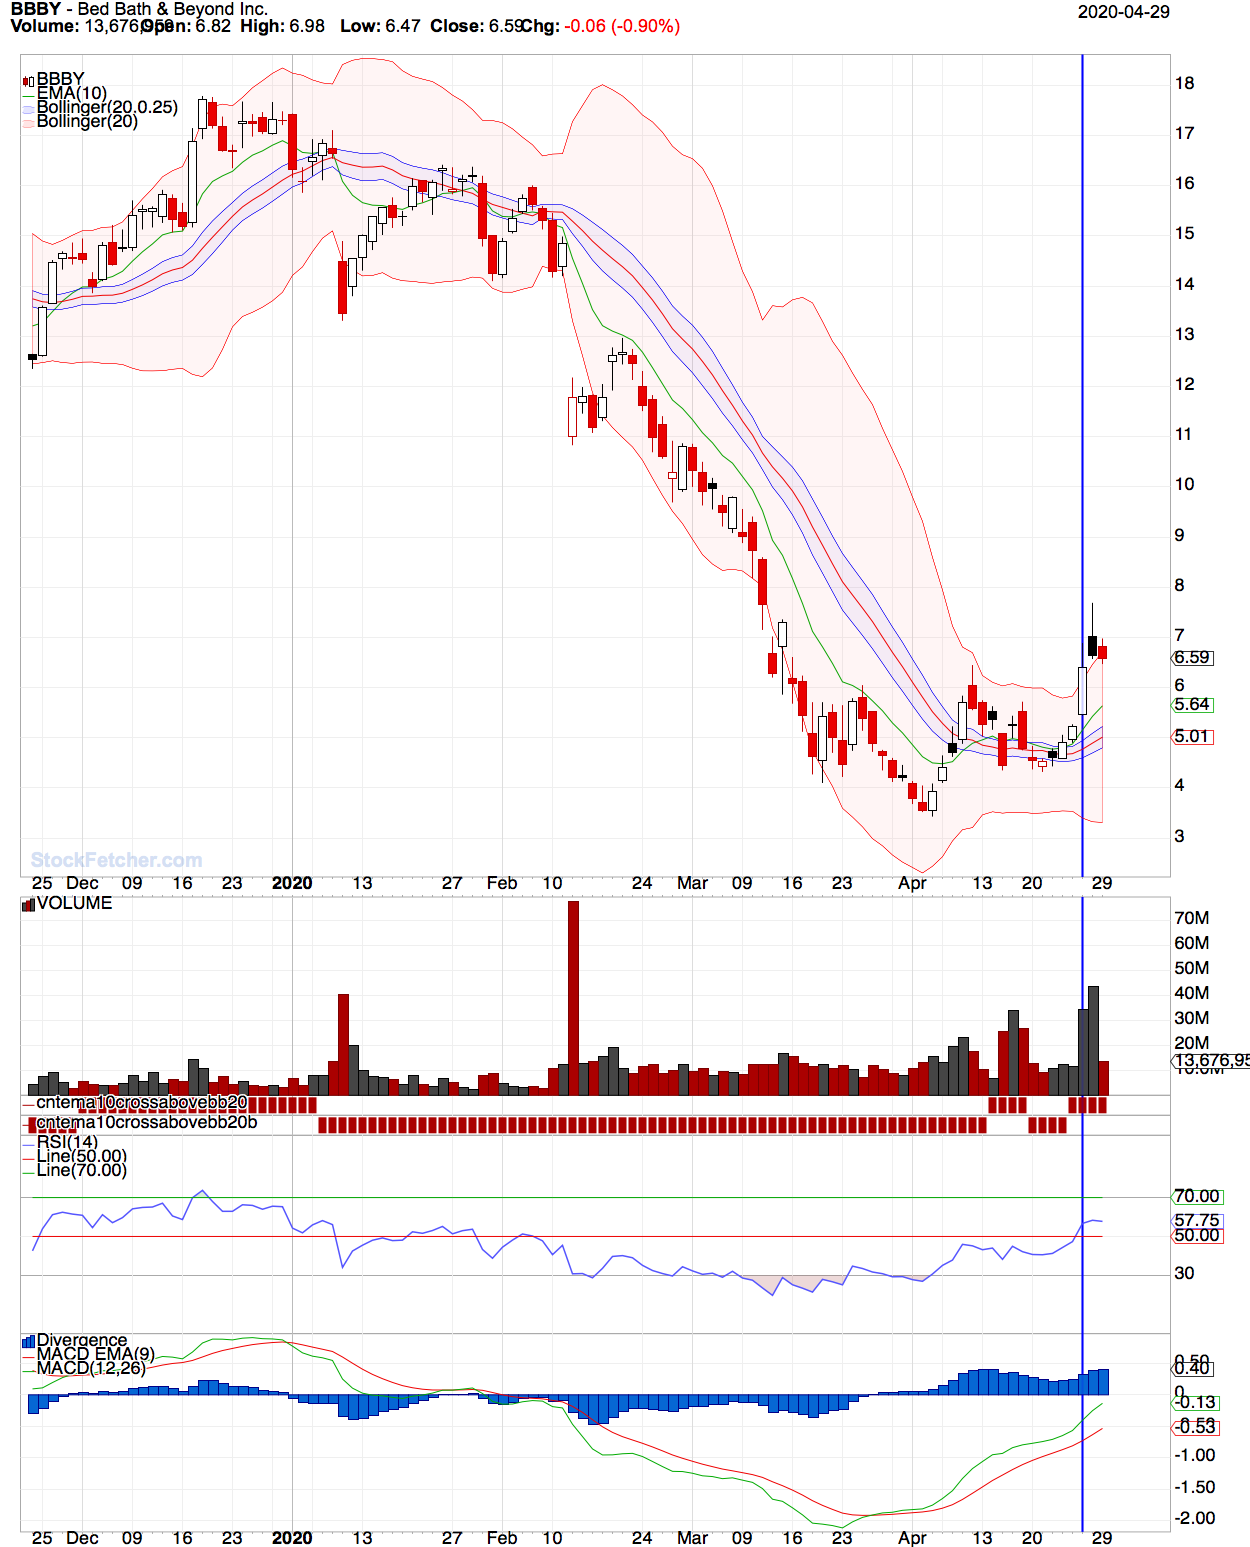 SDC 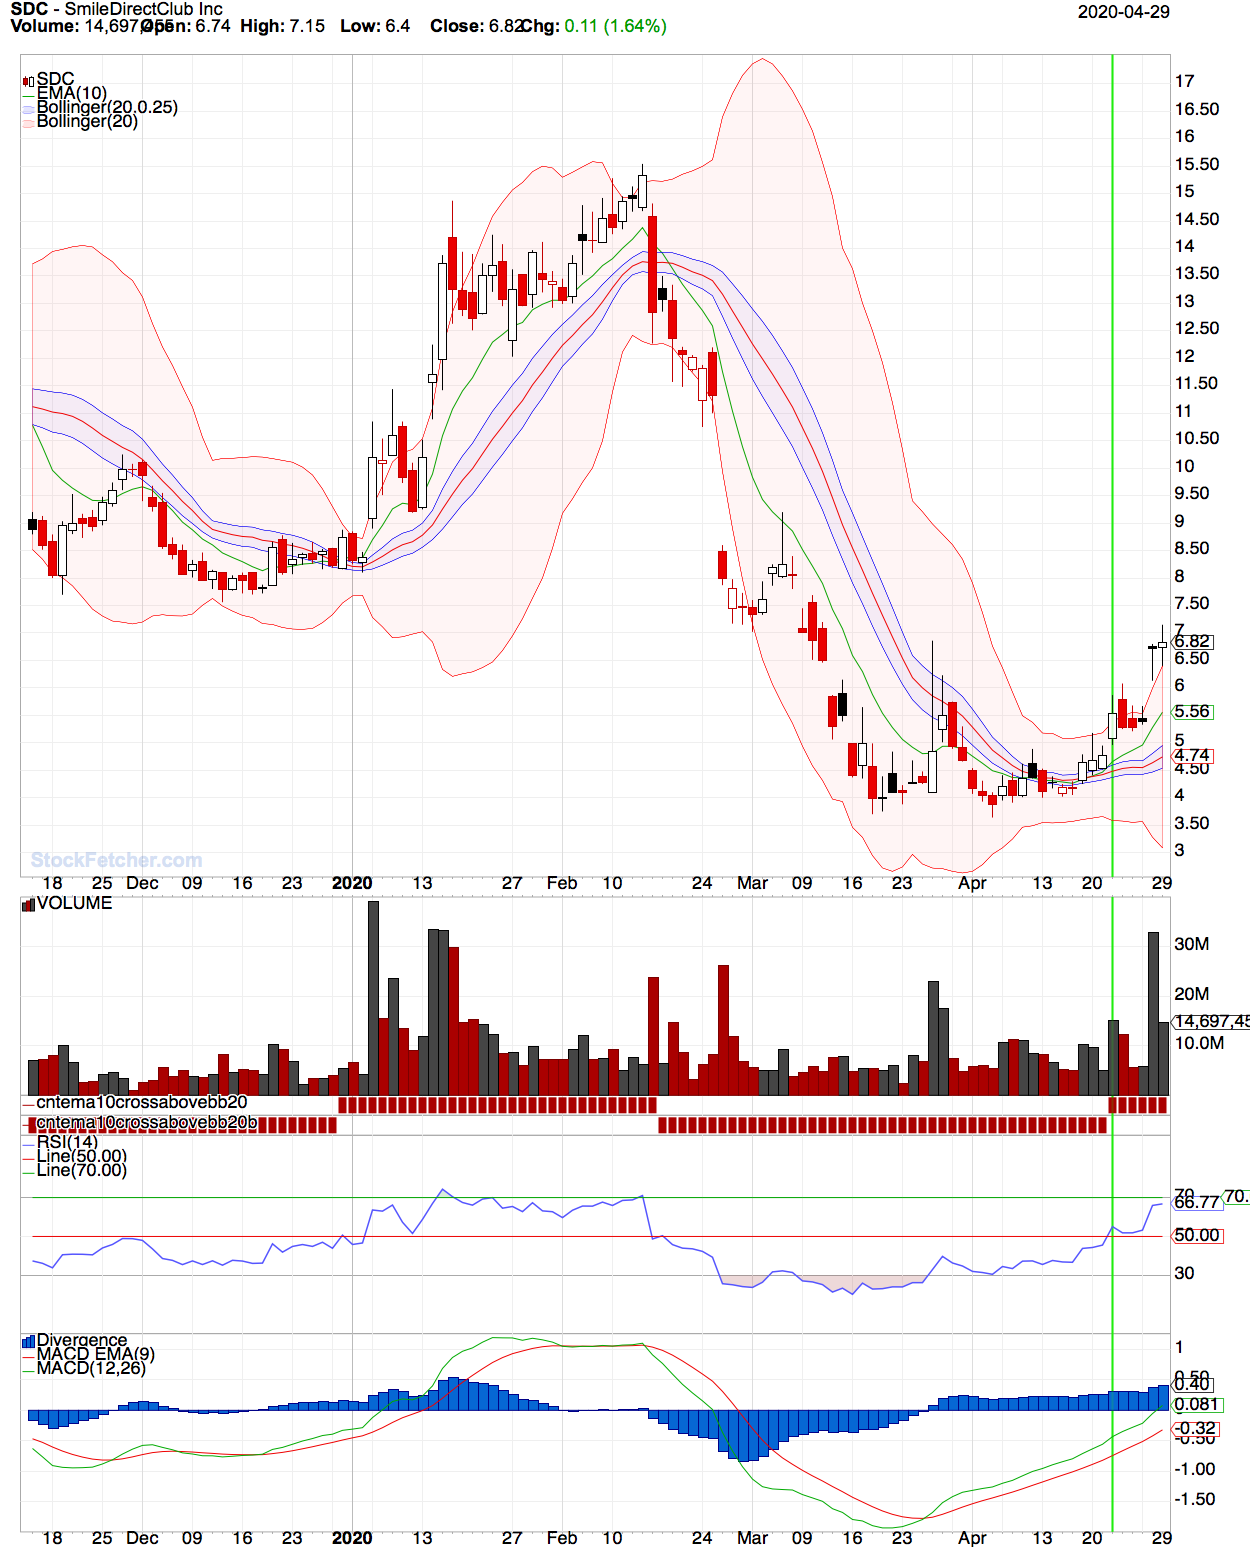 Price may not go up every day but its the change to a uptrend here were wanting to catch. |
| Cheese 1,374 posts msg #151965 - Ignore Cheese |
4/29/2020 6:00:44 PM Thanks again, Mac |
| Mactheriverrat 3,178 posts msg #151968 - Ignore Mactheriverrat |
4/29/2020 11:03:58 PM You Welcome Cheese. |
| JoeyVinyl 125 posts msg #152001 - Ignore JoeyVinyl modified |
4/30/2020 7:18:53 PM Okay, I'm confused (and not by the typo - you have */ where you should have /*). */ e13e26 is number of consecutive days ema(13) above (+)/below(-) previous eMA(26) */ set{e13e26b,days( ema(10) is above Upper Bollinger Band(20,0.25),250)} set{e13e26a,days( ema(10) is below Upper Bollinger Band(20,0.25) ,250)} set{e10abovebb20, e13e26a - e13e26b} and add column e10abovebb20 {e10abovebb20} You're saying this section is counting the times the EMA(13) crossed over or under the EMA(26), but your set statements are using the EMA(10) and the BBs. It's the same for your other set statements that come after this section. I get having the EMA(10) cross the upper BB is part of the trigger, but where do the EMA's 13 and 26 come in? Also, you're subtracting the number of days that it's over the upper BB from the number of days that it's under the upper BB to get the number of says it was over. Doesn't your first set statement there give you that or am I missing something else there? |
| Mactheriverrat 3,178 posts msg #152005 - Ignore Mactheriverrat modified |
4/30/2020 9:35:46 PM You are correct Joey - I had the count code right but not the full code. My bad. I have updated the code in the first post. All should look right now. Thank Joey for the heads up. Mactheriverrat. Sometimes I get ahead of myself. |
| JoeyVinyl 125 posts msg #152014 - Ignore JoeyVinyl |
5/1/2020 4:56:08 PM No worries, Mac. I think we all do that. |
| Mactheriverrat 3,178 posts msg #152088 - Ignore Mactheriverrat |
5/7/2020 2:19:13 PM Still a good filter Ema(10) and Upper Bollinger Band(20,0.25) trigger also Karennma 317 trigger. Iv'e been messing with a ema10 cross trigger of ma20 as a trigger. All are great triggers. IMHO. |
| StockFetcher Forums · Filter Exchange · Ema(10) and Upper Bollinger Band(20,0.25) - Bullish filter. | << >>Post Follow-up |